
The identification of trends is one of the most crucial factors when trading in the stock market. However, this becomes a bit tricky considering that the market doesn’t move in a straight line. There’s no surety that a stock’s value will continuously fall on one day and rise on another. Thus, understanding how the market functions are crucial for beginning your trading journey. Only when you grasp the concept and the nuances of share market analysis, your chances of earning profits increase.
Understanding Trends in the Stock Market
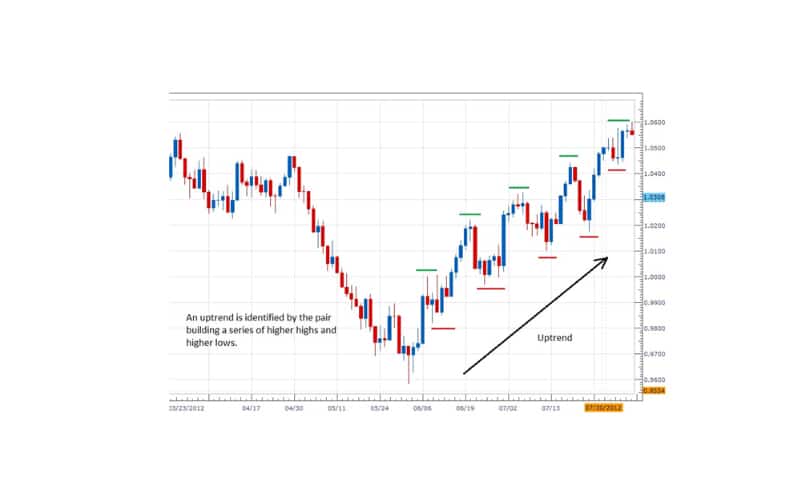
Stock prices exhibit volatility in the short term as they don’t move in a straight line. But when you zoom out on the price chart, you will see certain price patterns that you can spot. Generally speaking, a trend can be defined as a broad upward or downward movement of a stock’s price over a period of time. If you are an investor, always look to sell stocks that are in a downtrend or buy stocks when they are in an uptrend. For a movement to be considered a trend, it must occur over a specific time period.
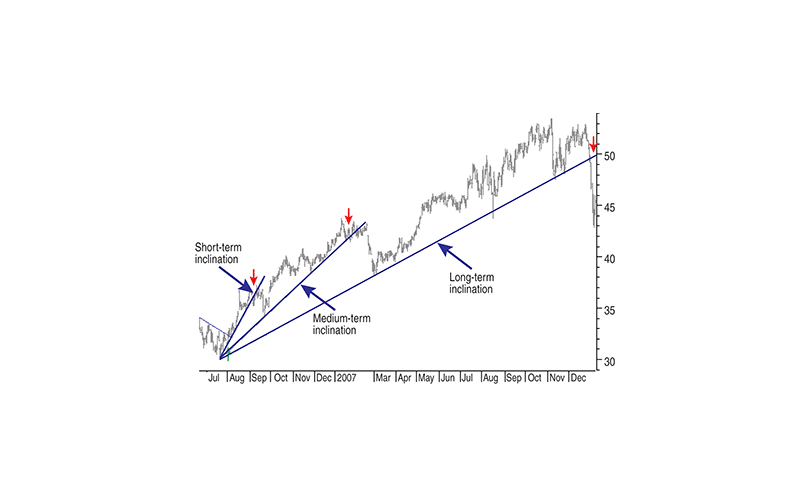
You can use trend analysis to predict any type of trend. This can take the form of a bull-market run, which you ride until data suggests a reversal in the trend. It focuses mainly on three types of time horizons: short-term, immediate, and long-term.
How to Confirm the Validity of A Trend?
When considering a trend, there is no specific time frame involved. A series of price movements can only be considered as a substantial trend if it’s legitimate and not just an anomaly. All experienced investors can identify this and use some basic rules for performing accurate stock market trend analysis.
We need a minimum of three data points. A trend with three or more points of contact is a valid one.
Watching the Slope
You can find out how much the price should move daily by examining the slope of a trend. Normally valid trends exhibit steep, upward, or downward moving lines. However, if the line appears too flat, you should reconsider the validity of the trend as it puts into question both its legitimacy as well as its predictive powers.
Direction Of Trend
There are three main directions in which a trend can move: sideways, up, and down. You should study the prices over a long period of time to get a better understanding of how these three types of trends appear on a chart.
Duration of Trend
Normally, the duration of a trend will tell you whether following that particular trend is worthwhile or not. The importance of a trend increases when a trend remains in force for a long time.
Timing the Trend
The validity of a trend also depends on the amount of time. As an investor, you should always consider monthly time series first as it carries greater importance than both weekly and daily prices.
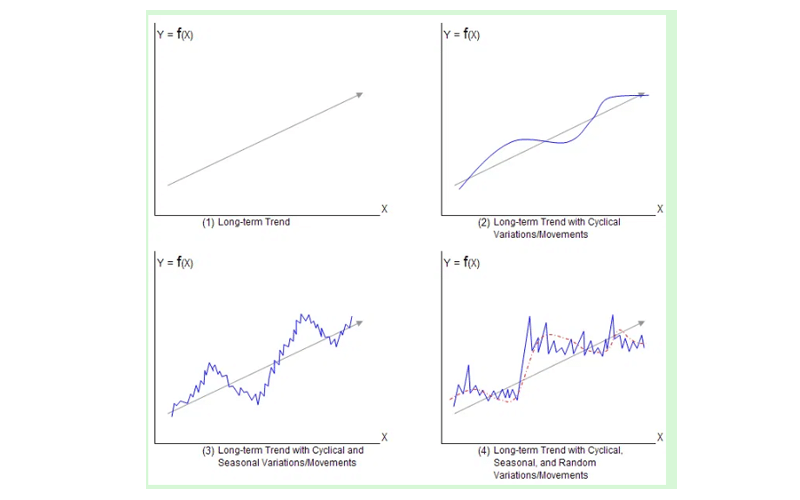
However, monthly trends only account for how individual stocks or markets perform between months. But this does not take seasonality into consideration. Doing a year-over-year analysis, in this case, helps.
The Importance of Share Market Trend Analysis
The entire process of analyzing current trends to produce predictions of future trends is known as equity market trend or share market trend analysis. By conducting a share market trend analysis, you can easily predict whether a particular sector that is growing will continue to grow in the future. You can also use it to find out whether a particular sector’s market trend influences or starts a trend in another sector. However, keep in mind that share market trend analysis is not always 100 % correct, as it involves a lot of different data and factors.
The main goal of conducting share market trend analysis is to predict trends. IF the trend you predict ends up to be a bull market run, you can ride it until you encounter signs of a trend reversal.
Because of the myriad of data involved in share market trend analysis, you must first select a particular sector. You can either focus on investments such as the bond market or target a particular industry such as the pharmaceutical sector. Once your sector is picked, you can start analyzing it.
Both internal and external factors will directly affect your stock market trend analysis. For instance, factors such as a new government regulatory policy or changes in an industry similar to the one you picked are all forces that impact the market. You can then use this data to attempt to predict the direction the trend will take. Remember, never to trade against trends in a market.
How to Identify Trend Changes?
Trend analysis is instrumental in identifying changes in trends. Even though there are many methods you can use, there are two trend analysis methods and tools which you can use easily.
- Stock Screeners: One of the most common tools for trend analysis is the stock screener, which will allow you to filter stocks according to categories. In other words, it allows you to set your own metrics, displaying results as per that criteria.
- Company News Catalysts: News catalyst can be any piece of news that causes a dramatic change in the price of a stock. It can include things like a new product announcement, a civil lawsuit, a merger or acquisition, etc.
- Global Economic Trends: FED decisions not only affect the forex market but the stock market as well. The changes in interest rate has a direct influence on the economic and stock market growth cycles.
Conclusion
Analyzing stock market trends can help you tip the odds in your favor. It can help you select the best times to enter and exit stock positions. Analyzing stock market trends are also helpful for spotting warning signs before an impending danger.