
Understanding how technical analysis can be applied to the forex market is essential if you want to be successful as a trader. Technical analysis is as old as almost the market itself and can be described as using the information available on the left side of a chart, to forecast prices on its right side.
In forex trading, traders have used a variety of methods to trade currencies, including using pattern recognition approaches and sophisticated theories for analysis. However, a trader also has a variety of tools at his or her disposal, including trend indicators and oscillators. Indicators can be considered the primary tool for practicing technical analysis and come in various shapes and sizes. Each of these helps the trader to handle the price action into a manageable context. These include the RSI or Relative Strength Index, Moving Averages, and Bollinger Bands.
Trading Cryptocurrencies Using Moving Average
Another example of a trend indicator used by traders to analyze the markets is the Moving Average – MA. There are different variants of Moving Averages, such as the Exponential Moving Average or EMA or the Simple Moving Average or SMA. The main idea here is the division of the price action into bearish and bullish.
If the price is above the Moving Average, it will find support. Your typical reaction will be to go long. However, if the price goes below the MA, traders usually look to sell spikes into it. The support and resistance provided become stronger as more periods are considered. The same can be said about time frames, i.e. the larger the timeframe, the stronger the support and resistance.
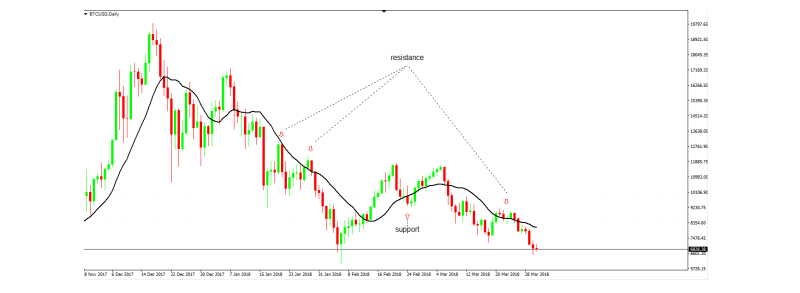
The above daily chart is for BTC/USD, where the black line is above the Simple Moving Average (14). In other words, the MA averages the closing prices for the past 14 days, plotting a value on the chart. The Simple Moving Average (14) acted both as support and resistance. This provides excellent opportunities to either go short or long.
You can use the Moving Averages to look for death and golden crosses. To apply this strategy, you will require two SMAs: SMA (200) and SMA (50). When the SMA (50) crosses above the SMA(200), the price enters a bearish market and a death cross is formed.
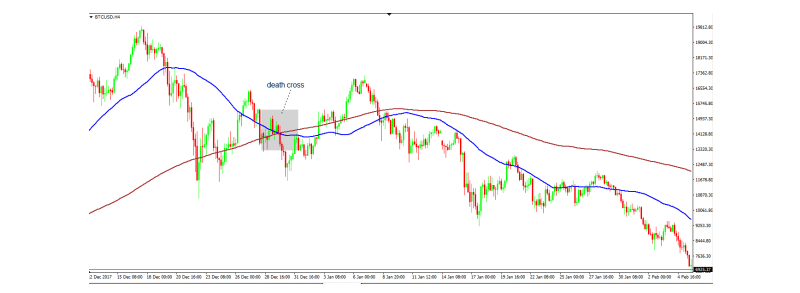
In the above chart, we can see that a death cross is formed at the start of 2018 on the BTC/USD 4 hour timeframe. Here, the price was around 14000. At the end of March, however, we see that the value drops to about 7000. Thus, we can say that the death cross was an early predictor of Bitcoin entering a Bearish market.
Trading Cryptocurrencies Using Bollinger Bands Indicator
The Bollinger Band is a trend indicator, listed as such and available in popular trading platforms including MetaTrader 4. It offers detailed information about the price action in a market. Bollinger Bands consist of 3 lines which all follow price: The Upper Bollinger Band(UBB), the Middle Bollinger Band(MBB), and the Lower Bollinger Band(LBB).
Here, the MBB acts like an Exponential moving average. It shows potential resistance or support for future prices. A bearish trend starts when the price breaks below the LBB and sellers emerge on ever spike into the MBB line. Consequently, when the price hits the UBB mark, traders expect a bullish trend. They thus buy on dips into the MBB.
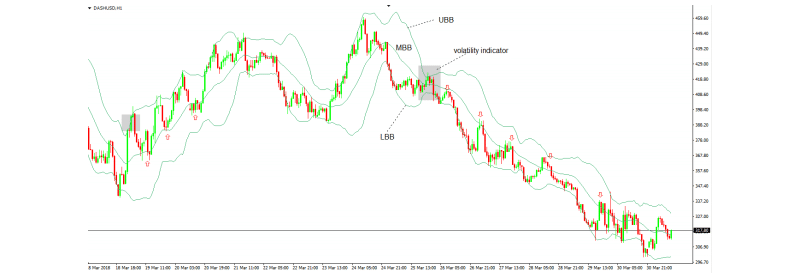
The above chart is for DASH/USD, where the price action acts as a confirmation of this strategy. Both shorts and longs worked successfully with the Bollinger Bands. The main feature of Bollinger Bands is its ability to signal a potential breakout. You should regularly check the distance between the LBB and UBB. From the above chart we can see that when the bands narrow, the new trend is stronger than normal, as proven by the recent bearish trend.
Trading Cryptocurrencies Using RSI (Relative Strength Index)
The Relative Strength Index is perhaps one of the most popular oscillators ever created. Just like any other oscillator, the RSI appears at the bottom of a chart, using a formula for plotting a value that mirrors price movements. The default period for the RSI is 14, which means that it plots value derived from the past 14 candles.
The RSI is restricted within a range of 0 to 100 and only travels in positive territory. The market, however, rarely goes to such extremes. The RSI comes with 2 default levels, 30 and 70. When the RSI moves below the 30 mark, traders should go long. This is because the market is in oversold territory. Traders should short the crypto pair they are trading when the price crosses over the 70 mark. However, note that this strategy is only applicable when the market is in a range.
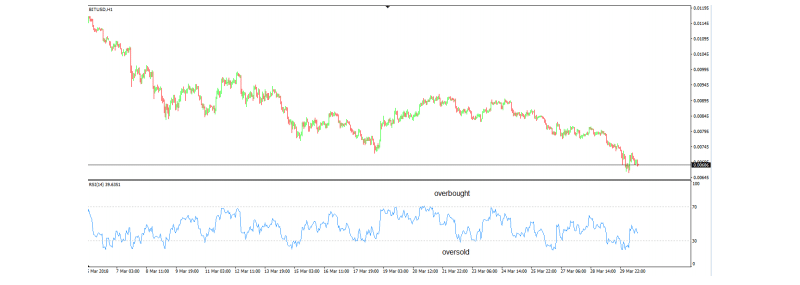
The above chart is for BTC/USD on an hourly timeframe. As the series of lower highs continues, a bearish trend comes into existence. As long as trending conditions remain, buying in the oversold territory is extremely risky. On the other hand, it makes more sense to sell in the overbought area.
You can use the RSI for spotting trend reversals as well. As the RSI follows the highs and the lows of the market, traders can look for divergences between the two.
In the Bitcoin Vs Ripple chart below, a terrible divergence can be seen which is bearish in nature. Even though the price keeps advancing and making 2 highs, the Relative Strength Index fails to confirm the 2nd one. As it’s a bearish divergence, you should go short.
Conclusion
With the growth of retail trading as well as internet connectivity, the cryptocurrency market has attracted an unprecedented number of traders to either invest or speculate, both of whom are attracted by the market’s volatility. Speculating mostly deals with technical analysis and the understanding of market psychology. Using trend indicators and oscillators are a great way for novice traders to profit off the market, using a calculated and secure approach.