• Best Managed Accounts
  • Best IRA Accounts
  • Best Forex Brokers
  • Best Forex Robots
  • Best Saving Accounts
  • Best Stock Brokers
  • Best Crypto Platforms
  • Best Crowdsourced Review Sites
No Result
View All Result
MFA
  • Top
  • Investing
    • Forex Trading
    • Stock Trading
    • Crypto Trading
    • Mutual Funds
    • ETFs Investing
    • Bonds Investing
    • Real Estate Investing
    • Investment Apps
  • Passive Income
    • Automated Trading
    • Managed Accounts
    • Passive Income Apps
  • Money Management
    • Banking
    • Savings Accounts
    • Money Market Accounts
    • Financial Advisors
    • Financial Independence
    • Saving Money
    • Paying Off Debt
    • Make More Money
  • Retirement
    • 401(k)
    • IRA
    • Retirement Planning
    • Retirement Calculator
  • Reviews
    • Online Brokers
    • Robo Advisors
    • Signal Providers
  • News
No Result
View All Result
MyFinAssets
No Result
View All Result
Home Investing

What is Debt to Equity ratio

September 28, 2020
in Investing, Stock Trading
0
A A
0
What is Debt to Equity ratio

Debt to Equity ratio (D/E) is one of the fundamental financial metrics that help to estimate the health of a company through its capital structure of debt and Equity. D/E shows how much the company relies on either its wholly-owned funds or debt to finance the business operations. 

We can calculate the debt-to-equity ratio by dividing the Total Liabilities of a company by its Total Shareholders’ Equity.

Trade like pro, no experience needed
Best Managed Accounts 2022

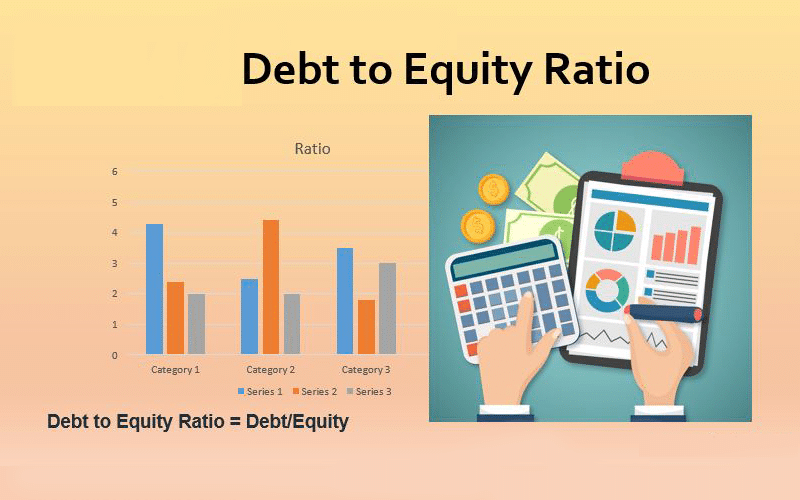
Here is the formula:

Debt/Equity

Total Liabilities is the sum of everything the company owes to other parties. Total Liabilities mostly vary by their timeframes. There are long-term liabilities and short-term liabilities.

Long-term Liabilities include debt instruments(debentures) with maturity over one-year, deferred tax liabilities and pension obligations. 

Short-term Liabilities include payrolls, rent, debt to creditors and suppliers (Accounts Payable), and money owed to customers. These debts are due within one year.

One more group is Other liabilities, which includes sales taxes, intercompany borrowings and other irregular debts.

Total Shareholders’ Equity is the difference between a company’s assets and liabilities. In other words, It’s the company’s resources available to cover debts.

On the company’s Balance Sheet, we can find all the elements for the formula of D/E ratio.

What D/E ratio can tell about the company

By looking at the D/E ratio, we can see how risky it is to do business for a company. 

For example, the company “A” has $100,000 in debt and $20,000 in Equity. The company “B” has $300,000 in debt and $500,000 in Equity. Let’s calculate their D/E ratios.

D/E (A)
D/E (B)

The company “A” has a higher D/E ratio than company “B”; therefore, if other conditions remain equal, “A” company’s business operations are riskier. “A” is more likely to experience instability in its performance as a significant amount of profits is dedicated to financing the debt. If the factor of uncertainty kicks in, such as change of market environment, accident, economic downturn, etc., company “A” will suffer the consequences more severely because it has a smaller financial buffer to keep paying off its debts. Company “B”, has more of its own money and in theory can pay off the whole amount of its debt at any time, if it’s needed. It creates more certainty in the company’s operations. Investors or creditors would see “B” as a less risky company and hence attractive for investments or lending out.

If debt enables to increase earnings by a greater amount than the interest, the company can remain attractive for investors as the retained earnings can still be paid out in dividends. If the opposite occurs, investors may sell the stock of such company.

Often, consistent zero or too low debt can be a sign of the company’s underperformance. A company may struggle to generate enough earnings even to sustain the core business operations. Creditors would hesitate to lend money to a company like that, so the debt stays consistently low.

D/E and its relative nature

Different industries have different capital needs, so a “good” D/E ratio is different for each industry. For example, Building Construction companies traditionally have an average D/E ratio of over 1.00 (2017-2019). The nature of their business requires significant capital investments in construction projects; therefore, they often need substantial loans.

On the contrary, Educational Services don’t require to invest significant amounts of capital in a short time in their business operations. Their D/E ratios stayed under 0.5 from 2017 to 2019.

Investors should compare the D/E ratio to the average of the company’s industry to get objective results.

Dig deeper into debt ratios

D/E ratio only gives a general picture of the company’s indebtedness. To get a clearer picture, we should look beyond the total numbers and see what D/E ratio consists of for a particular company.

The shorter time a company holds the debt, the cheaper it is due to the number of interest payments. Long-term debt has a greater impact on a company than the short-term debt. Therefore, investors should look closely into the structure of the debts of the companies they compare. 

Analyze companies with the D/E ratio – read between the lines

Let’s compare two Oil companies – Pioneer Natural Resources Company (NYSE: PXD) and Concho Resources Inc. (NYSE: CXO) Below we can see charts of their Long-Term Debt, Shareholder’s Equity and D/E ratio. 

Pioneer Natural Resources Company (NYSE: PXD)
Concho Resources Inc. (NYSE: CXO)

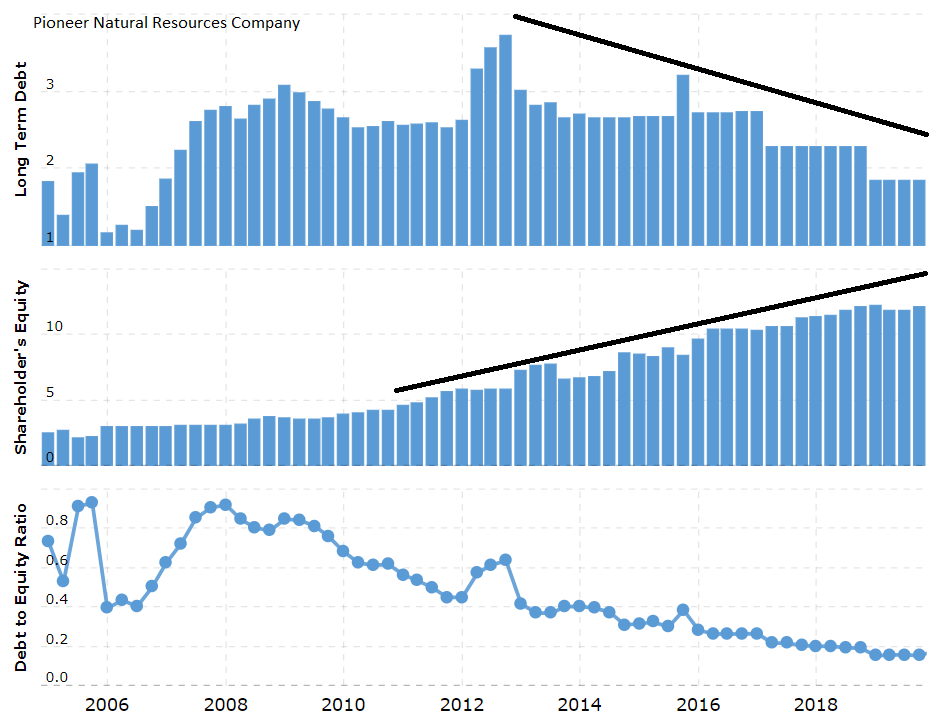
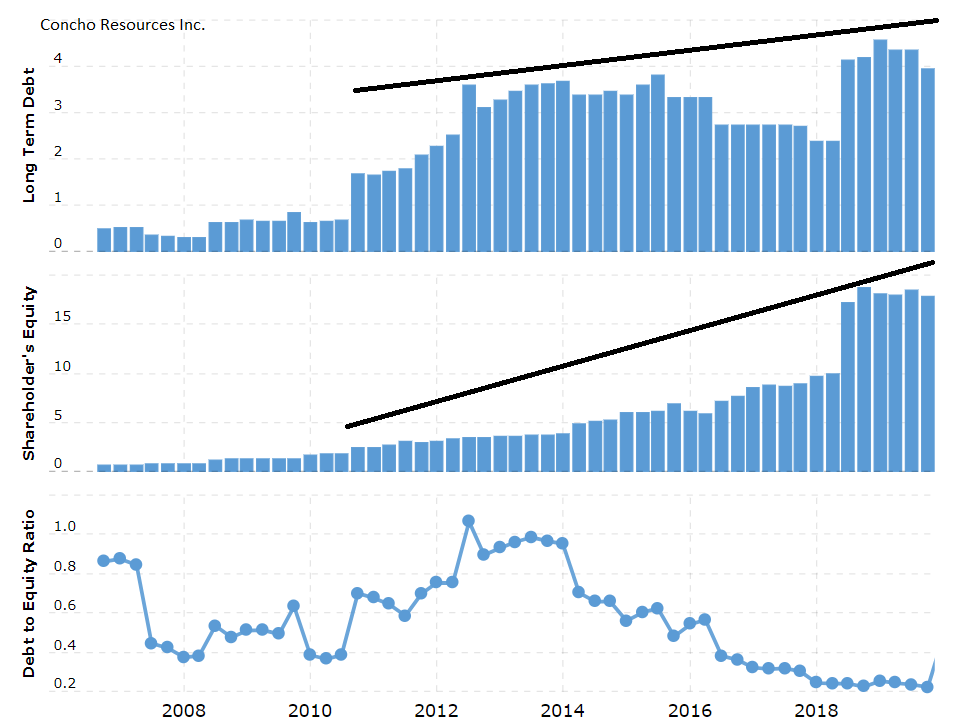
At the end of 2019, PXD and CXO had similar D/E ratios, 0.15 and 0.22, respectively. Shareholder’s Equity charts are in an uptrend for both companies, that indicates growth in the retained earnings. However, The Long-Term Debt of CXO is also in an uptrend, which means the company keeps borrowing to propel the increase in revenues. On the other hand, the Long-Term Debt of PXD is decreasing, as the company manages to pay off its debts while growing earnings. In terms of the dynamics of debt, PXD looks better in perspective. 

Looking at the dynamics of change in debts and Equity can give more valuable insights about the company’s performance. 

Trade like pro, no experience needed
Best Managed Accounts 2022
TweetShareShare
Previous Post

Top 5 Cryptocurrencies By Market Cap

Next Post

What is Market Capitalization?

Related Posts

Using a Trend Filter To Befriend the Trend in Forex

October 10, 2022

Guide on How to Trade Forex Using a Smartphone

October 10, 2022
WolfBot Crypto Bot Review: Key Aspects to Consider

WolfBot Crypto Bot Review: Key Aspects to Consider

Next Post
What is Market Capitalization

What is Market Capitalization?

5 Safe REITs to Invest in Today

5 Safe REITs to Invest in Today

Leave a Reply Cancel reply

Your email address will not be published. Required fields are marked *

Top Performing Trading Systems

TechBerry 95%
Forex Cyborg 80%
Automic Trader 75%
DynaScalp 70%
Happy Forex 65%

Follow our Twitter

Popular

  • Filing Forex Trading Taxes IRC 988 vs. IRC 1256: Step-by-Step Guide

    Filing Forex Trading Taxes IRC 988 vs. IRC 1256: Step-by-Step Guide

    0 shares
    Share 0 Tweet 0
  • How To Trade And Invest During The Earnings Season

    0 shares
    Share 0 Tweet 0
  • How to Invest With Grayscale Bitcoin Trust Indicator

    0 shares
    Share 0 Tweet 0
  • Happy News Review

    0 shares
    Share 0 Tweet 0
  • Understanding Wash Trading: Why Is It Banned?

    0 shares
    Share 0 Tweet 0

INVESTING

  • Bonds Investing
  • Crypto Trading
  • Forex Trading
  • Mutual Funds
  • ETFs Investing
  • Real Estate Investing
  • Stock Trading

RETIREMENT

  • 401(k)
  • IRA
  • Retirement Planning
  • Retirement Calculator

REVIEWS

  • Online Brokers
  • Robo Advisors
  • Signal Providers

MONEY MANAGEMENT

  • Banking
  • Financial Advisors
  • Money Market Accounts
  • Savings Accounts

PASSIVE INCOME

  • Automated Trading
  • Managed Accounts
  • Passive Income Apps

Are you looking for the best investment plan?

Let our financial advisors help you

Contact Us

PERSONAL FINANCE

  • Financial Independence
  • Saving Money
  • Paying Off Debt
  • Make More Money
  • Best Managed Accounts
  • Best IRA Accounts
  • Best Forex Brokers
  • Best Forex Robots
  • Best Saving Accounts
  • Best Stock Brokers
  • Best Crypto Platforms
  • Best Crowdsourced Review Sites
  • Home
  • Blog
  • Privacy Policy
  • Disclaimer
  • Contact Us

© 2023, Myfinassets

No Result
View All Result
  • Top
  • Investing
    • Forex Trading
    • Stock Trading
    • Crypto Trading
    • Mutual Funds
    • ETFs Investing
    • Bonds Investing
    • Real Estate Investing
    • Investment Apps
  • Passive Income
    • Automated Trading
    • Managed Accounts
    • Passive Income Apps
  • Money Management
    • Banking
    • Savings Accounts
    • Money Market Accounts
    • Financial Advisors
    • Financial Independence
    • Saving Money
    • Paying Off Debt
    • Make More Money
  • Retirement
    • 401(k)
    • IRA
    • Retirement Planning
    • Retirement Calculator
  • Reviews
    • Online Brokers
    • Robo Advisors
    • Signal Providers
  • News

© 2023, Myfinassets

Welcome Back!

Login to your account below

Forgotten Password?

Retrieve your password

Please enter your username or email address to reset your password.

Log In