Market Capitalization or “Market Cap” shows how much the market values a company. We can calculate Market Cap by multiplying the total number of outstanding shares by the current share price.
Here is the formula of Market Cap:
Market Cap = share price x number of shares outstanding
Imagine there is a new company that decided to go public (conduct IPO). Investment banks help the company to determine how many shares to issue and at what price. Let’s say the company decided to issue one million shares at $10 each. Hence, the Market Cap will be 1,000,000 x $10 = $10,000,000.
The company has been doing well, steadily growing its earnings over time. At the same time, people, seeing the successes of the company, become more optimistic about its future growth prospects and potential dividends. So, the public keeps eagerly buying the company’s shares, and the share price grows to $20.00 per share. Now, the Market Cap of the same company is 1,000,000 x $20 = $20,000,000.
What has changed, or what does the bigger Market Cap tell us about the company? The reason why the people kept buying the company’s shares and pushing the price higher is their faith in the value of the company.
We can conclude that the Market Cap represents the collective perception of the company’s value and the faith in its future growth.
Why it is important?
The Market Cap and its size is the result of the collective esteem by the market participants as they express their outlook about the company by buying or selling the stock and moving its market price in either direction. It’s important to understand, although the size of the Market Cap is the result of the judgements of many people, it doesn’t always show us the real value of the company. People are prone to mistakes in all aspects of their lives, and investments are not an exception. If even the professionals or “the smart money” are not so smart at times, how about the general public? People often follow dubious rumors or buy and sell out of strong emotions. So how can anything dependent on the market price objectively represent the actual value of a company? Only by analyzing the company’s fundamentals in context, investors can get closer to the truth.
What does the Market Cap size tell us?
Different groups of Market Caps range by their sizes. Every group implies specific risk parameters of the stocks in them. A prudent combination of the Market Caps from different groups can efficiently diversify a portfolio and meet the investment objectives of an investor.
Large-cap are companies that have over $10 billion market capitalization. Large-caps are usually well-established, successful companies that can generate a predictable amount of earnings consistently. Investors that are interested in the low risk and predictable dividends along with the significant likelihood of capital gain over time want to look into Large caps. The examples of such companies are Amazon.com, JPMorgan Chase & Co. or Microsoft.
Mid-cap companies range from $2 billion to $10 billion in market capitalization. They are typically established companies, although less than the Large-caps. Mid-caps are still in the phase of growth and carry a higher risk than the large-caps.
Small-cap is a group of companies that have the market capitalization between $300 million to $2 billion. These are young, dynamic companies that often do business in the specific niches and new industries. Investors usually see the highest growth potential in Small-caps. Along with the more significant growth potential, these small companies are riskier as they are more sensitive to the adverse changes in the economy. Small-caps are generally more volatile and less liquid than more prominent companies.
Micro-cap is the group of the smallest companies with the Market Cap between $50 million and $300 million. The majority of the companies in this group are penny stocks as they’re traded below $5 per share.
Market Cap and the Big Picture
Industry top professionals like Warren buffet and the investment management firm Wilshire Associates, Inc. used the Market Cap of the whole US market to invent the famous “Buffet Indicator” and the “Wilshire 5000 to GDP Ratio” respectively (see the charts below).
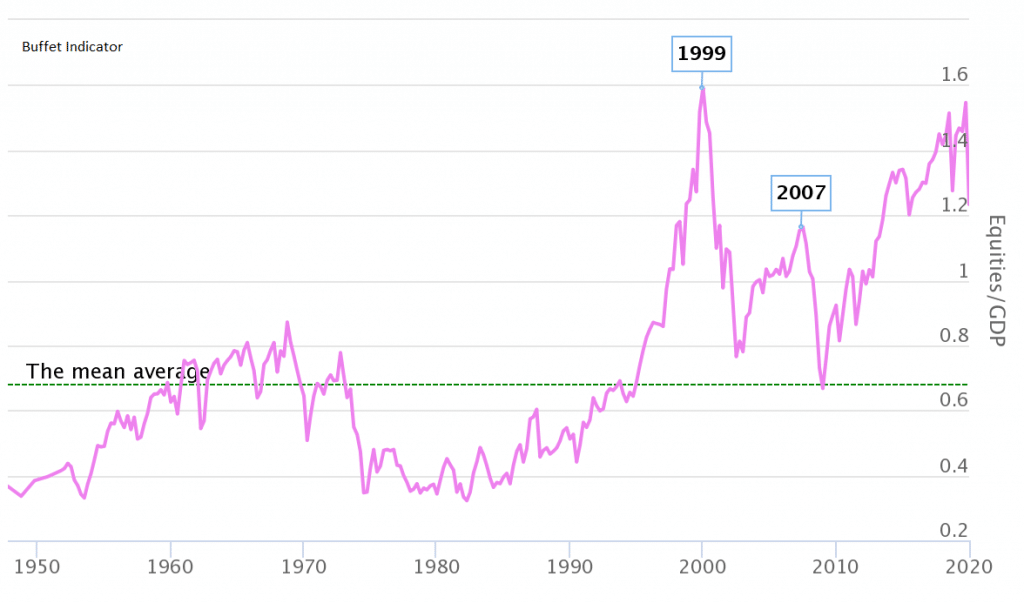
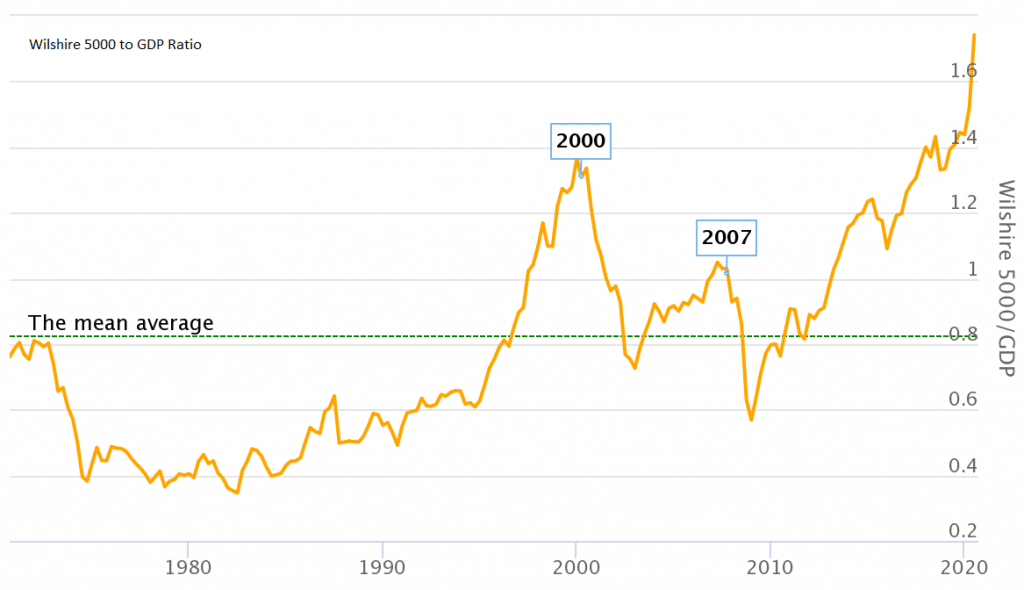
In essence, both indicators are the ratios of the total US market capitalization to the US GDP. The only difference is that Buffet Indicator is published quarterly, therefore lags three months behind, although it offers more historical data than Wilshire 5000 to GDP Ratio, starting from the 1940s.
When the ratios are at the mean average, the stock market is at the fair value. When the ratio is above or below the mean, the stock market is considered overvalued or undervalued.
The Bottom line
Market Cap can give investors a general picture about the potential growth and risks of investing in the company. However, to get a more objective view of the company’s value, investors should still look into the fundamentals in the financial statements. Total Market Cap to GDP ratio can give us a perspective about the value of the stock market as a whole.