Price-to-earnings ratio (P/E) is one of the basic metrics of fundamental analysis. It helps investors to roughly estimate the relative value of a company based on its earnings and the current stock price. Why “relative” value? Because P/E in itself doesn’t give us any meaningful input regarding the value of a company. It becomes useful only when compared with the P/E of other similar companies or the industry’s average.
The formula of P/E ratio is the following:

Where “Stock price” is the current market price of the company’s stock. We can find “Earnings per share” (EPS) by going to the Income statement and dividing the net income by the total number of outstanding shares. The P/E ratio value is usually shown based on the past twelve months.
Limitations of the P/E Ratio
There are limitations of the P/E ratio. The extreme price volatility or how earnings are calculated can distort the objectivity of the P/E ratio.
Investors want to know what earnings they can expect in the future. Knowing only past earnings’ data doesn’t always provide the right outlook. To address this issue, we can use the Forward P/E ratio. In this case, we divide the stock price by the future earnings forecasts of professional stock analysts.
The absence of the earnings growth factor is another limitation of the P/E ratio. For this reason, investors use the Price/Earnings-to-Growth ratio (PEG). This is a modified P/E by factoring in the earnings’ growth variable.
Here is the formula of PEG:

How to use P/E ratio in the real world
If you want to use the P/E ratio in your analysis, you should make sure that the P/E of the company of your choice is objective. That means the stock price is not the result of unordinary factors. Earnings should be “organic” too.
There are times when the market prices consistently deviate from usual readings. Fundamental trends can cause such fluctuations. During such periods, prices are particularly relative. What seems low, often goes lower and what seems high goes higher.
Look at the history of earnings. Are there any significant spikes in the trend’s dynamics? If there are, that can signal that the income is obtained in an “unusual” way which is typically unsustainable. For instance, if a company sold a part of its assets, the income can skyrocket, which doesn’t mean the company performs better than before.
A company must consistently have positive earnings, otherwise, its P/E ratio is meaningless.
Let’s look at the example below.
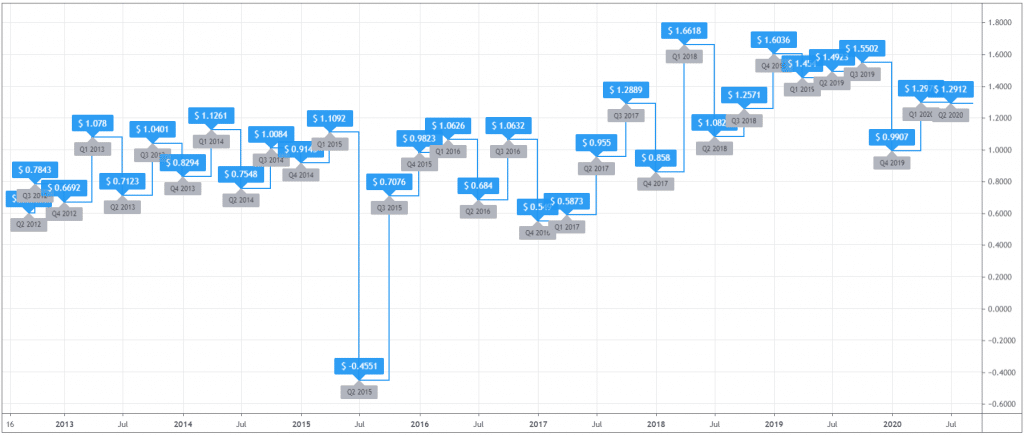
Here we have the history of earnings of The Hershey Company (NYSE: HSY). The majority of the readings are consistently positive and don’t deviate much from their theoretical mean. You want to see this kind of history of a company’s earnings to consider its P/E ratio.
Now let’s see the price chart for HSY.
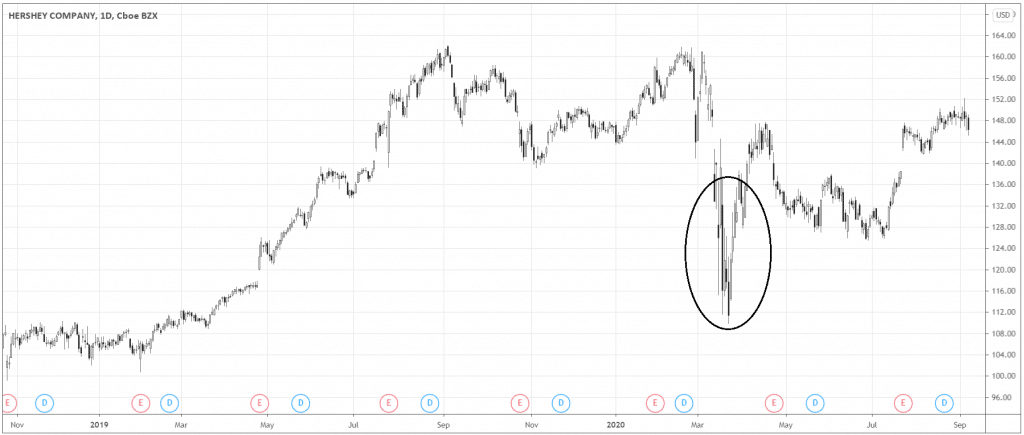
As we experienced the market plunge in March, P/E ratio during the decline could be very attractive (circled area). However, I would be very cautious considering the price during this kind of periods. The situation with COVID-19 and fears of the recession was the recipe for the continuation of the bear market, in such times P/E ratio can continue declining as the overall market experiences a decline that’s fundamentally justified. When the market comes back to its normal volatility, we can consider P/E with more confidence.
Compare it right – simple stock valuation with P/E ratio
After you made sure the P/E ratio of a company you’re analyzing is objective, it’s time to put the P/E into perspective.
Different industries vary by their P/E ratios. Some P/E reading can be high for one industry but still be normal for another.
For example, the average trailing P/E in the oil exploration and production industry is 8.66. As oil prices slumped and remain close to the production cost, the profit margins of the oil companies shrunk and investors don’t expect much from this industry soon.
From another side, online retail industry develops rapidly and has big profit margins, the industry’s “normal” trailing P/E amounts to whopping 243.82.
You can compare the P/E of the stock you’re considering to the P/E of its industry. If the P/E is lower than the industry’s average, the stock might be undervalued. If the P/E is higher than the average, the stock might be overvalued.
Another point to consider is the number of companies that belong to the industry. Suppose there are too few companies in the industry. The statistical sample can be insufficient. Therefore, if you still want to use P/E, you can consider comparing the stock’s P/E to the similar industries or its sector, take this as the last measure though. I’d personally prefer not to look at P/E in this case.