Return on Investment (ROI) is a profitability measure expressed as a percentage. Investors can use ROI to evaluate the efficiency of an investment or compare the profitability of different investments. ROI shows the return from an investment compared to the initial cost.
Here is the formula of ROI:

Let’s look closer into each part of the formula.
Current Value of Investment is the monetary value that an asset has after an investor had invested in it a particular period ago. For example, if you bought 100 shares of XYZ stock at $20.00 per share a month ago and now your 100 shares cost $25.00, the Current Value of Investment would be $25.00×100=$2500.
Cost of investment is any resource you spent to get the Current Value of investment. According to our previous example with the purchase of XYZ stock, the Cost of Investment would be $20.00*100=$2000.
Therefore, ROI of XYZ investment is

The case with XYZ stock is a simplified example. In the real world, the Cost of Investment can go far beyond the initial market price of an asset.
Cost of Investment also can include other factors:
- Transaction cost – The fees or any charges that an investor had to pay to execute the transaction of a purchase.
- Taxes – It’s the percentage of the capital gain that you will pay in taxes.
- Time – How long it took to reach the gain (or Current Value of Investment)?
- Inflation – How much is the gain affected by inflation? What purchasing power will the gained capital have in the future compared to the present day? In other words, the estimation of real returns versus nominal returns.
- Opportunity cost – What returns would you have gained if you used your initial capital for another kind of investment instead?
How to analyze potential investments with ROI
ROI works well when we need to calculate the profitability of an investment that is historically relatively predictable. To get a more accurate estimation, we need enough past data about gains of the specific kind of investment we’re interested in or at least a similar one.
Compare average historical returns
Let’s say an investor wants to invest in a stock index of one of the major economies for five years. The investor considers between S&P 500 and FTSE 100.
First, we need to compare the performances of the S&P 500 and FTSE 100 over five-year periods. It’s better to use a significant sample of past data for the law of large numbers to play out.
We will look at the period from 1984 to 2019. The average annual performance over five-year periods for FTSE 100 (1984–2019) is 8.92% and 9.38% (excluding 2019-2020) for the S&P 500. We can call these returns “Current Value of Investment”. We also need to add the annual returns from dividends, which are about 4.11% for FTSE 100 and 2.2% for S&P500.
Look into the costs
Next is the more challenging part – analyze the “Cost of Investment”, especially the hidden costs.
The transaction costs are the most fixed part of the equation. We can check the fees of the entity through which we will invest. If we invest in Indices with ETFs, we will bare the annual fees (“expense ratio”) starting from 0.1%.
Taxes can be one of the highest costs of investment. In the UK you’d pay 10% capital gains tax and about 7.5% income tax on the dividends. In the US, for the long-term investments, the maximum tax on capital gains and dividends is 12%.
The time in this comparison is five years for each investment.
Get down to the numbers
Let’s calculate the projected ROI if we invest 10,000 in the local currency of the USA and the UK for five years.
1)As we need to take into account the annual “costs” like taxes and expense ratio before we reinvest gains from dividends, in the tables below we can see how the end year balance for the investments in S&P 500 and FTSE 100 change after the costs.
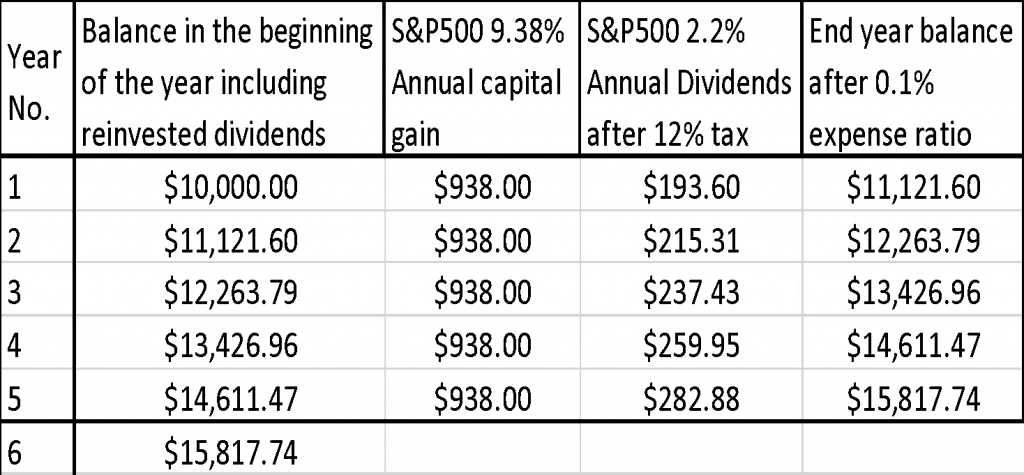
Total capital gain = $4,690.00
12% Paid as a capital gains tax = $562.80
Final balance after capital gains tax = $15,254.94

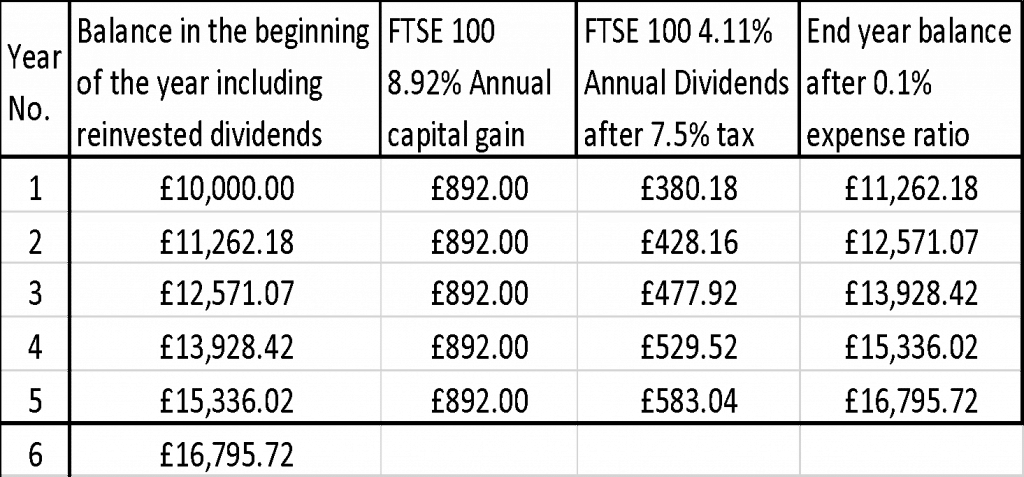
Total capital gain = £4,460.00
10% Paid as a capital gains tax = £460.00
Final balance after capital gains tax = £16,349.72

We found that the ROI of FTSE 100 is higher than the S&P 500. You can also consider the effects of inflation on your real returns and the exchange rate of the currency of your investment. The rates of taxes depend on the amount of your gain and the holding period. Remember, past performance doesn’t guarantee future results. ROI provides only a rough estimation of a potential income. Investors should always take its readings with the grain of salt.