
Candlestick patterns are useful tools used in price action trading strategies. Forex traders use these patterns individually or in combination with other technical indicators like the moving average and the average directional movement index (ADX).
Some of the most popular candlestick patterns are triangles, bullish and bearish pennants, and double tops and bottoms. In this article, we will compare the head and shoulders pattern with the cup and handle patterns.
What is the head and shoulders pattern?
The head and shoulders (H&S) is a pattern made up of four key parts. It has a left shoulder, a head, right shoulder, and a neckline. Its name is derived from the fact that it resembles the formation of a person’s upper side.
The H&S is usually a reversal pattern that happens when the price of an asset is going upwards. When it forms, it signals that buyers are losing momentum and that there are new sellers coming in. Therefore, in most cases, the price will ultimately move below the lower side of the neckline.
How the head and shoulders pattern forms
The formation of an H&S pattern is relatively easy to explain. First, the price needs to be in a bull run for it to form. As it rises, it finds initial resistance, which sees it continue dropping as some sellers come in. This level of resistance forms the left shoulder.
In the next step, more buyers come back in and push the price of the asset higher. They move to a level that is above the left shoulder. This level becomes the head.
Third, after forming the head, the price finds further resistance that pushes the price lower. The lowest point that the price drops. But again, the decline is usually relatively muted, and ultimately, the price tends to bounce back to a level relatively lower than the head. This forms the right shoulder.
As all this happens, the neckline is usually horizontal or diagonal. In the final stage, the price will tend to drop below this level and continue falling.
How to trade the head and shoulders pattern
The process of using the head and shoulders pattern is relatively simple. First, you need to identify the left shoulder, head, and neckline. With these three, you can easily tell that the pattern is indeed forming.
Therefore, in an ideal situation, you should place a short position when the price starts forming the right shoulder. In this situation, you should place the take-profit below the neckline. While there is no universally-accepted principle, most experts recommend taking profit three times the distance between the neckline and the head level.
Another risk-averse strategy of using the head and shoulders is to use pending orders. In this case, if the neckline is at 1.1200, you can set a sell stop at 1.1150. Doing this will mean that the order will be implemented if there is indeed a bearish breakout.
Head and shoulders example
A good example of a head and shoulders pattern is shown in the four-hour EUR/USD chart below.
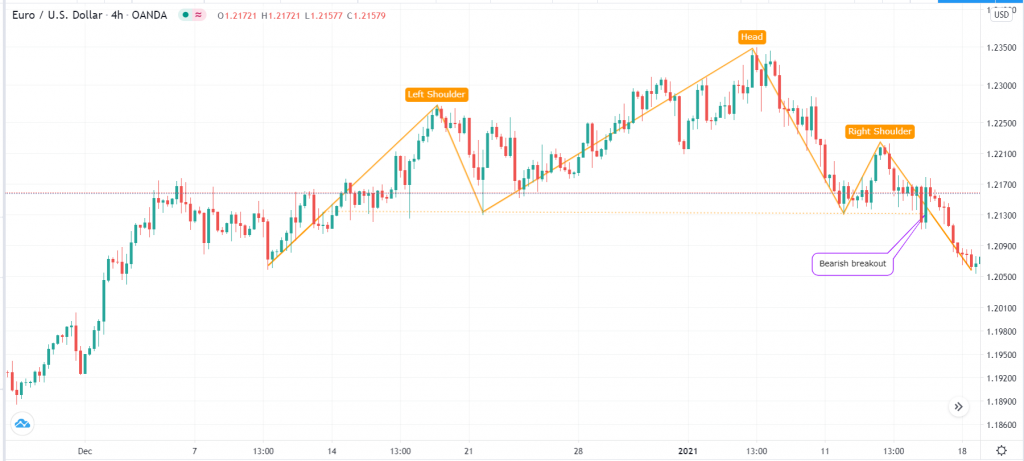
The head and shoulders pattern can also happen when the price of an asset is falling. When this happens, it is known as an inverse head and shoulders and is usually a sign of a bullish breakout.
Cup and handle pattern
The cup and handle (C&H) pattern is another popular pattern that is usually used by price-action traders. However, unlike the H&S, the C&H pattern usually takes time in a long period. At times, it can take years for it to completely form.
The situation usually starts when the price of an asset is in a bullish trend. In this period, there are usually more buyers than sellers. However, after reaching a certain point, the price starts to fall as sellers start coming in. As the price falls, sellers might then lose momentum while some buyers may start coming in.
Subsequently, the price will start going upwards and ultimately reach the previous high point, which is now a resistance level. At this stage, some buyers will start again to question the strength of the rally. As a result, the price may either drop further or form a consolidation pattern.
In due course, in a cup and handle pattern, the price will break-out higher since the original bull thesis is still intact.
Cup and handle pattern example
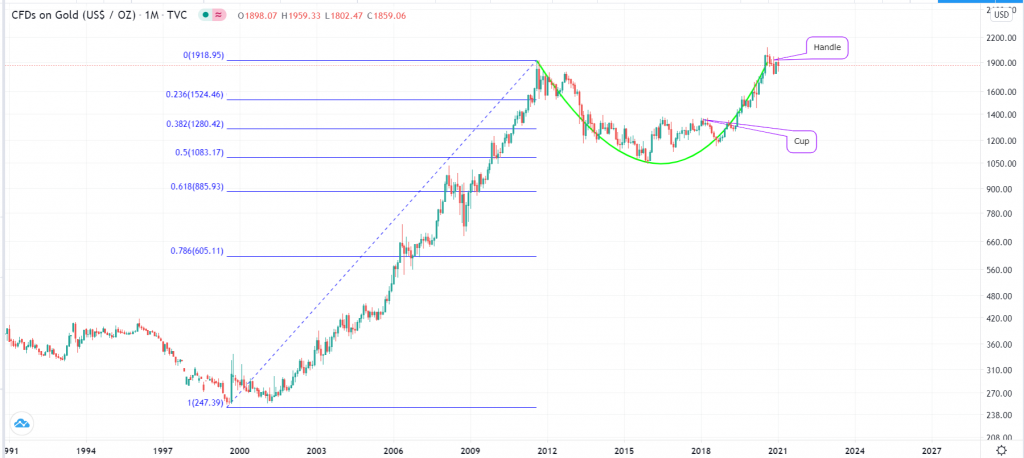
A good example of a cup and handle pattern is what happened in gold in the past few years. As shown below, the price of gold was in a strong rally until September 2011, when it reached an all-time high. After that, bears started to overwhelm the sellers, pushing the price lower. It dropped until the 50% Fibonacci retracement level and then started a slow climb again.
In 2020, the price rose and moved above the previous all-time high and then went through a consolidation pattern, which is now the handle pattern. If the pattern works out fine, it means that the price will resume the upward trend as more buyers come back in.
Cup and handle pattern
Head and shoulders vs. cup and handle
These two patterns are usually common among price action traders. The cup and handle pattern tends to take a long period to form compared to the head and shoulders pattern.
To use them well, we recommend that you combine them with other tools. In the example above, we have combined the cup and handle with the Fibonacci retracement tool. You can repeat the same with other tools like the Andrews Pitchfork and the Gann fan.
Final thoughts
Price action is an excellent strategy to day trade the financial market. It usually works across all financial assets like commodities, currencies, stocks, and even exchange-traded funds. The main challenge with the two patterns is that some are not common. For example, it usually takes a longer period to identify a cup and handle pattern. Therefore, you should spend time learning other patterns like triangles and pennants.