
The three rising valleys are concurrent V-shaped low points in price trend lines, each higher than the previous one. They indicate a short-term bullish reversal as they begin from a downtrend. The price that forms the first valley is joined by a falling price move that picks up after the first valley. Tall patterns have the best performance as they increase with a peak in the volume. Formations where the breakout is close to the yearly high have a better performance in predicting the bullish trend after the 3 valleys close. They are also called triple bottoms.
The three minor lows can be traced on a straight line, plotted from the first minor low to the third. They also have similar shapes in terms of length and width. Traders will need to be careful as the pattern may lead to a bearish continuation, especially if it has a downward breakout. In this case, it leaves off the bearish reversal and proceeds on a downtrend.
Identification guidelines
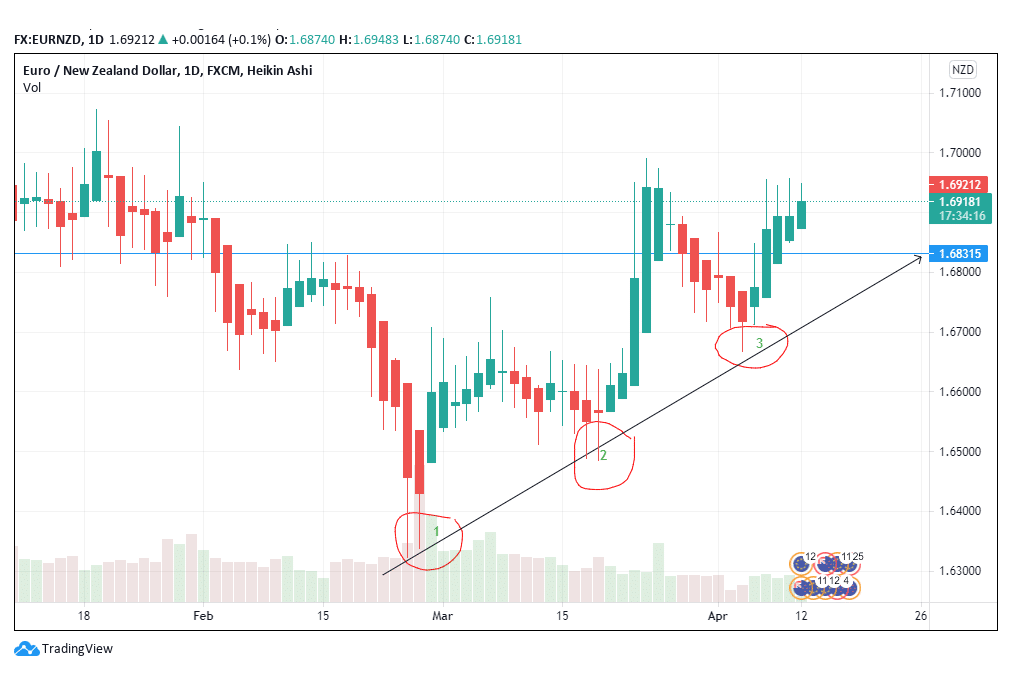
Figure 1: The three rising valleys in EUR/NZD
They appear in a downtrend
The three-rising valley (3RV) pattern appears in a price downtrend especially in a bearish market that is about to hit a reversal. They may also appear in an uptrend, but the performance is limited as compared to a downtrend prior to the price line.
The pattern acts as a reversal, therefore a downtrend is best suited to move the price target higher. A trader that spots the rising valley forming into the downtrend should buy the currency pair as it mostly denotes a bullish reversal.
Contains three rising valleys
The triple bottoms are important for confirming the predicted price movement. Figure 1 shows that the bottom of each valley is higher than the prior one. This trend continues until the price hits the third bottom. The middle valley helps to form the third and it may be wider as the price struggles to control the movement.
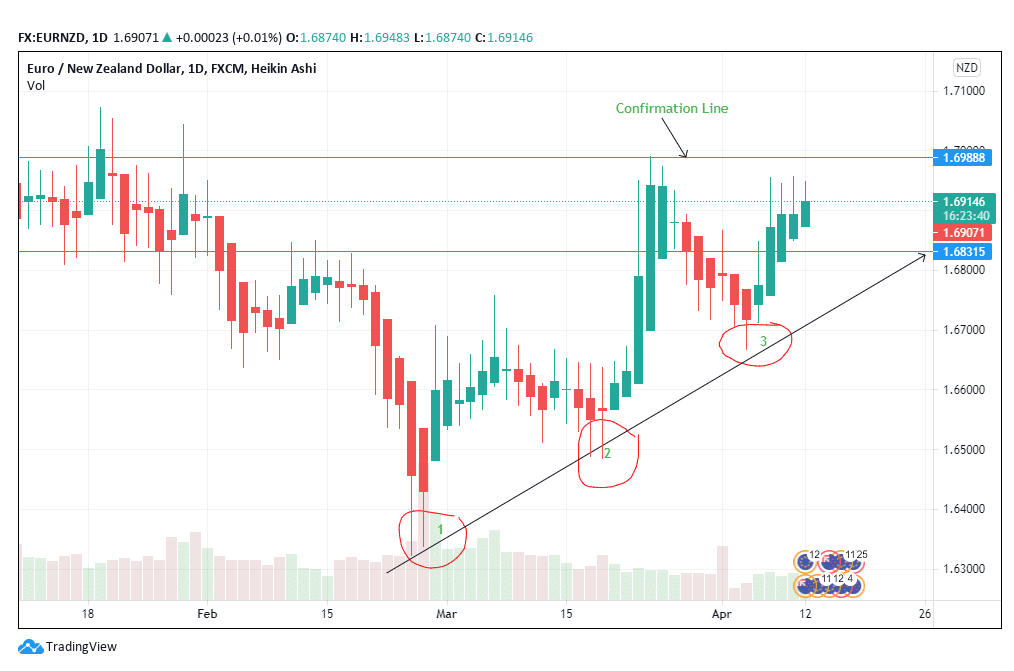
Figure 2: Confirmation line on the EUR/NZD pair
Proportionality of the lows
While it is important to ensure that the 3RV looks similar in terms of length and size, it is also vital to consider the volume of the price movements. In figure 1, the second bottom is wider as compared to the first and the third. However, the pattern obeys the reversal rule indicating that the formation is correct.
The middle bottom is wider as it first denotes a decrease in volume after a higher trend was exhibited in the first bottom. The volume declines until the price joins with the third bottom. Falling volume is important in confirming the decrease in prices at higher margins. Remember that the bottoms are formed from a short uptrend.
Confirmation price
The confirmation line is the final point that marks the beginning of the third valley in the trading chart. In figure 2, the confirmation price is at 1.6989. At this price, there was a short downtrend to allow consolidation at point 3. The price then surged towards 1.6951 as of April 12, 2021. There is an expectation that the price will continue with the uptrend since the pattern has already formed a 3RV.
Points to note
The trader needs to locate a low point on the trading chart from a previous downtrend. After locating this low point, identify the successive minor lows that are higher than the prior valley point. There are three lows or valleys that follow each other in an increasing trend line. These valleys have the same shape unless there is a shift in the volume pattern. Investment should be conducted only after the confirmation point has been spotted.
The 3RV appears mostly in the daily and weekly trading charts. Avoid looking for the pattern if you are trading with the hourly charts. The peaks (high points) and the troughs (valleys) appear as rising candlesticks (set in a series) within one larger time frame. The valleys have similar proportionalities that make trading and spotting them easier. Notice that in figure 3, the three valley points look similar in terms of depth and width. They are all narrow with rising price trends.
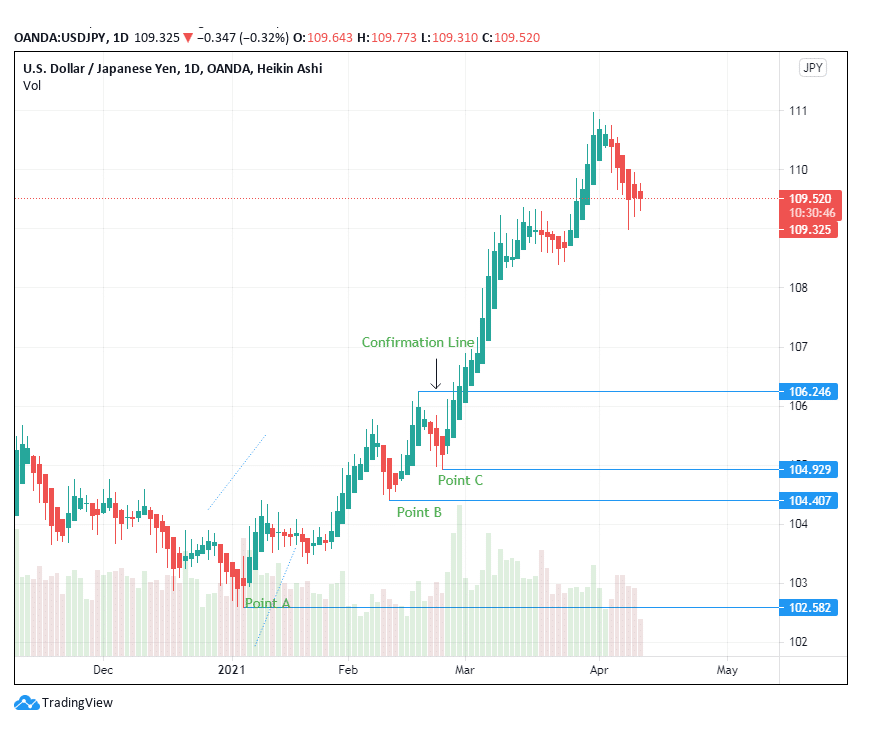
Figure 3: USD/JPY Trading Chart
We can conclude that the uptrend leading to the formation of point A is bullish. This conclusion may force the trader to assume that the 3RV pattern formed is a bullish continuation as opposed to a bearish reversal.
A look at figure 3 indicates that point A is formed by a retracement and not a reversal. The price is on a downtrend from December 2020 into January 2021. This picture also shows that the pattern works well when the first valley is near the yearly low. The two trading charts have retracements in the lead to the formation of the 3RV. The appearance of a false continuation is central to the strength of the 3RV in predicting a bullish reversal.
Figures 2 and 3 also show that the breakout volume needs to be less than the peak and trough volumes. A high breakout volume does not support an uptrend in price. Instead, it forces a downtrend. When the trader notices a high breakout volume at the confirmation, he should prepare to short the currency. Such a case also warrants the use of stop-loss in case it begins to depict an uptrend.
Place the stop loss option slightly below the right (last) minor low/valley. In figure 3, the stop loss should be placed between 104.929 and 104.407. Place the stop loss after confirming the existence of the 3RV.
Conclusion
The three rising valley pattern is composed of three troughs with two peak points that lead to a bullish reversal. It is formed close to the yearly low, with three successive lows rising after each other. The trader should only go long after spotting the confirmation line above the third valley.