The Commodity Channel Index (CCI) gives us the weight of the price movement of assets over different timeframes. It compares current prices and a previous average over a certain time period.
How CCI works
When the market becomes very volatile, the indicator tends to register high figures. A low reading means prices are well below normal. As a result, it becomes a question of personal judgment as to whether an asset is overbought or oversold.
When the index signals that an asset has become overbought, the asset may still rise further. In a similar vein, when an asset is oversold, it is still feasible that the value of the item may continue to decrease in value.
We get a buy signal when the CCI rises over +100, which indicates that a fresh, significant uptrend has begun. It is preferable to sell when the reading goes below +100, which signifies the beginning of a big slide. When that happens, you should consider closing the position.
However, it should be noted that when working with extremely volatile assets, you may need to change the levels. You may use the figures +200 and -200, for example, if you are trading an asset that is naturally more volatile than the market average.
Divergence may be an early sign of a reversal if the CCI does not confirm that the trend is continuing. When using a scale between +100 and -100, the range of values will change based on the number of periods you choose to include. Consequently, a shorter CCI is produced, which has a lower number of values and is considered more volatile.
Calculating CCI
We compute CCI by subtracting the mean price of an asset from that asset’s long-term average. We then compare this difference to the average difference in the analysis time period. The volatility of assets may be taken into account by comparing the differences between the averages. Multiplying by a constant ensures that most numbers fit inside a typical range of +/- 100
CCI = (AveP – SMA_of_AveP) / (0.015 * Mean Deviation)
Where:
AveP= Average /typical price= (High + Low + Close) / 3
CCI strategies
Overbought/oversold
In its default configuration, the CCI weighs the prevailing price of an asset versus the average in the previous 14 periods. A reading above 100 denotes overbought, and below it, we have oversold.
When the CCI for the EURUSD moves between the two crucial thresholds, we can see how the price responds, as seen on the daily EURUSD chart above.
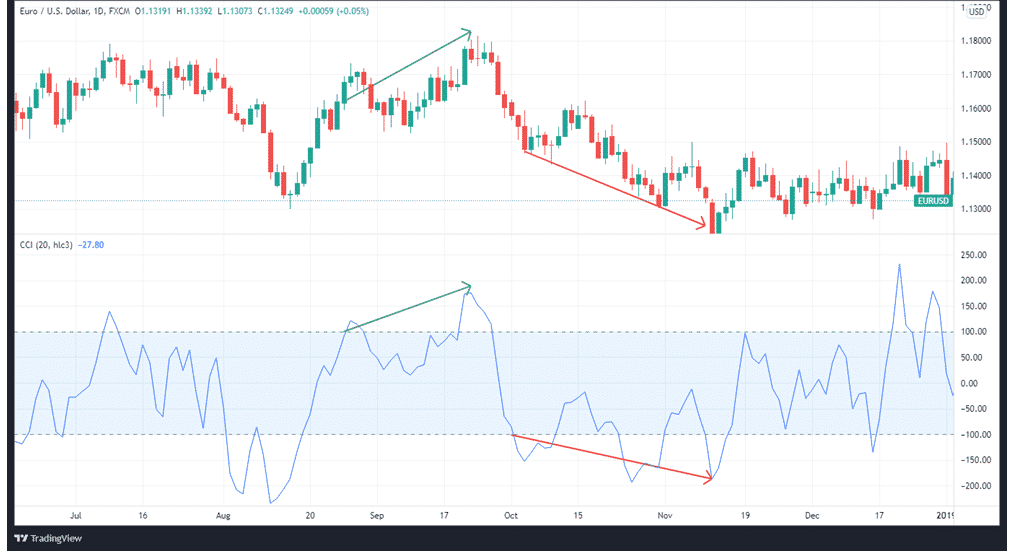
CCI in divergence
Divergences between the CCI and the actual changes in price can also be used to boost the intensity of signals.
In a strong trend, divergences may be deceptive, so don’t get too enthusiastic about them as strong reversal signals. It is not uncommon for a strong uptrend to display several negative divergences before the actual peak of the trend. In contrast, in long-term downtrends, bullish divergences are common.
When a positive divergence develops below -100, it intensifies the signals even more when it returns to the +100 side of the equation. Similarly, positive divergence over +100 that is followed by a move below +100 has more impact.
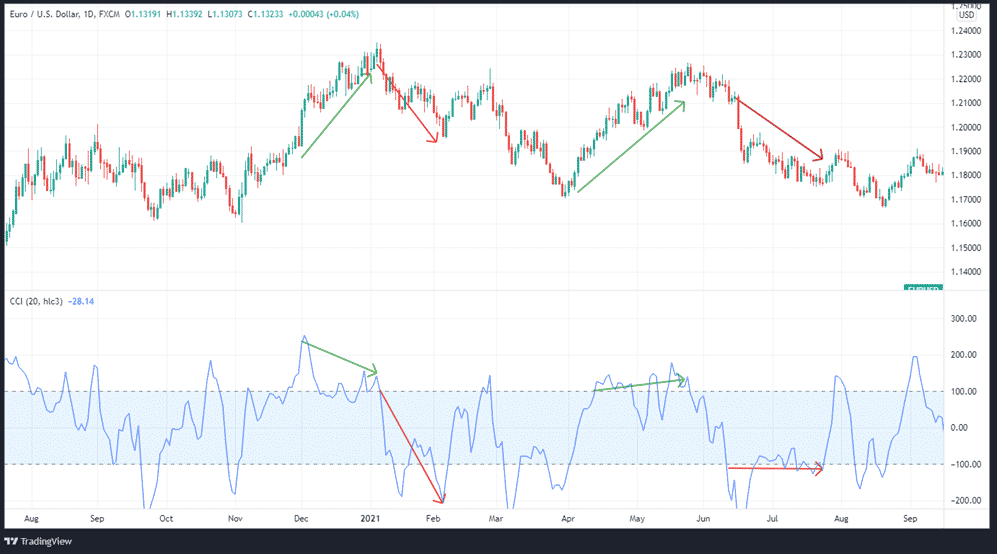
Below, we see the market behavior when the indicator is above +100 and below -100, as shown in the EURUSD daily chart.
Traders utilize the CCI or the chart to identify a confirmation point for divergences. For a bearish divergence to be confirmed, a break below zero in the CCI must occur or a breach below support on the chart. We need a break above point 0 or a movement above a resistance line for a bullish case.
The trendline as a reference point
Breaches above or below trend lines can trigger trading positions on the CCI.For instance, on the EURUSD daily chart below, the price was previously indicating “overbought”, shown by a rise above +100 and a breach of the trend line. This signaled impending bearishness, and the price went down soon after. In the second instance, the price was trending downwards, and it breached the trendline near the –100 level. This signaled impending bullishness, and the price rose again thereafter.
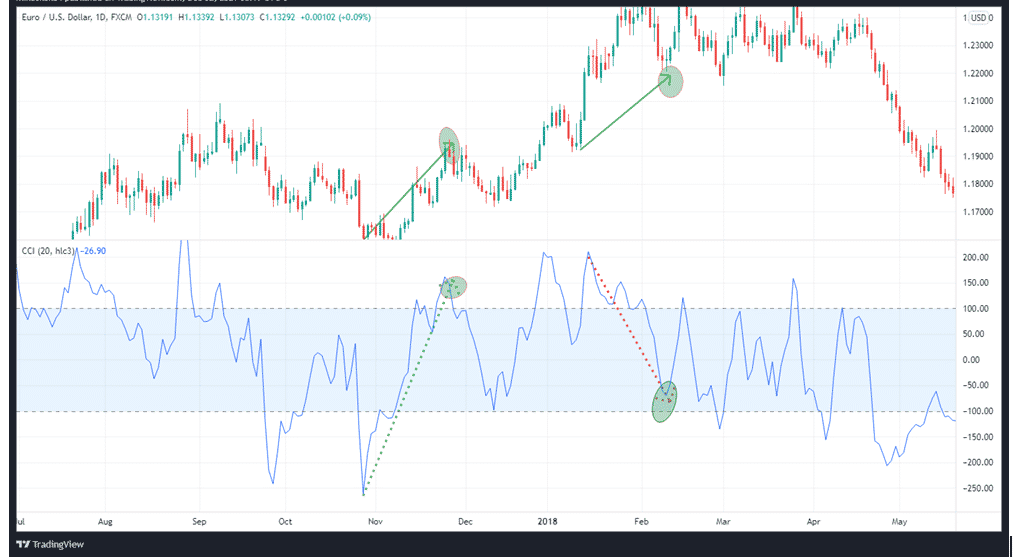
To create trend lines, simply join the chart’s high points to low points.
In summary
CCI tells us how much an asset’s price has moved concerning the typical price movement in the past, usually 14 periods. The presence of high positive ratings implies that prices are significantly higher than their mean, which is a signal of market strength. A low reading means that prices are much below their historical mean, suggesting that the market is faltering. Utilize this knowledge to take profitable positions.