What Is Price To Earnings Ratio?
The price to earnings ratio or P/E ratio is the ratio to value a company that measures its present share price relative to its per-share earnings. Trading experts also sometimes call the price-to-earnings ratio as the earnings multiple or the price multiple. Investors and analysts use P/E ratios to determine the relative value of the shares of a company in an apples-to-apples comparison. They can also use it for comparing a company against its own historical record. Another use of these ratios is comparing aggregate markets over time or against one another.
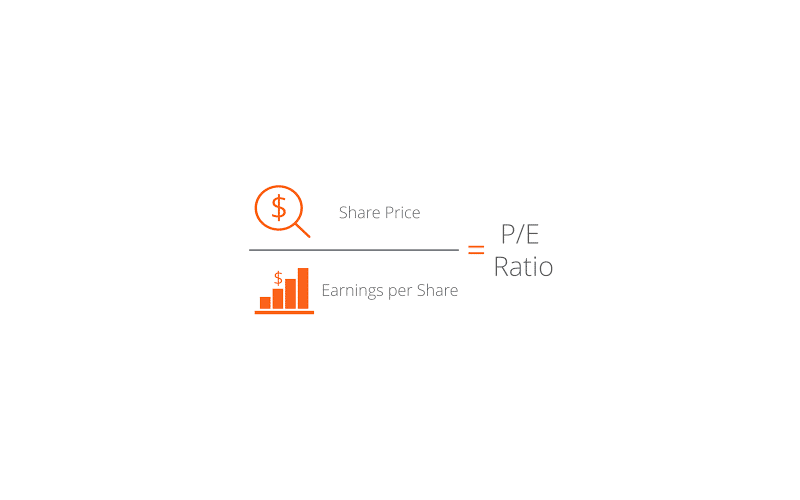
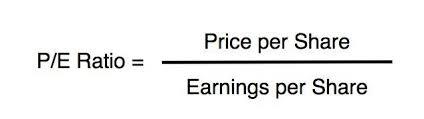
You can calculate the P/E ratio by dividing the market value share price by the company’s earnings per share. Earnings per share of EPS is the amount of the company’s profit that it allocates to each outstanding share of its common stock. It serves as an indicator of the financial health of the company. In other words, it is the portion of the net income of a company that it can earn per share if all profits are paid out to the shareholders. Typically, analysts and traders use EPS to establish a company’s financial strength.
Real Stock Price to Earnings Ratio Example
As a historical example, we can calculate the price to earnings ratio for Walmart Stores Inc. The company’s stock price closed at $91.09 on November 14, 2017. The company made a profit of $13.64 billion for the fiscal year ending January 31, 2017. The number of shares outstanding of the company was 3.1 billion. You can calculate its EPS as $13.64 billion / 3.1 billion = $4.40. Therefore, the P/E ratio of Walmart is $91.09 / $4.40 = 20.70x.
Simple Way to Value A Stock with Price to Earnings Ratio
The price to earnings ratio is one of the metrics that investors and analysts use the most to value stock. Apart from showing if the stock price of a company is overvalued or undervalued; the P/E ratio can reveal the comparison between a stock’s valuation and its industry group or a benchmark. The ratio helps investors in determining the market value of a stock in comparison to the company’s earnings.
To put it simply, the price to earnings ratio shows what the market wills to pay for stock as per its past or future earnings. If the P/E is high, it means that the price of the stock is highly relative to earnings and it is probably overvalued. On the contrary, a low P/E shows that the stock price is low relative to earnings and possibly undervalued.
However, companies that have faster growth than average usually have higher P/E ratios, such as technology companies. A higher P/E indicates that investors are ready to pay a higher share price right now due to the expectations of growth in the future. The historical range for the average P/E is from 13 to 15. For instance, if the current P/E of a company is 25 above the average, it can trade at 25 times earnings. The high multiple shows that investors expect that this company will grow higher than the rest of the market. So, as you can see, a high P/E does not always indicate an overvalued stock. You also need to consider any P/E ratio against the backdrop of the P/E for the industry.
Investors use the P/E ratio not only to determine the market value of a stock but also to determine future earnings growth. For example, if earnings are going to rise, investors may expect the company to increase its dividends as well. Usually, rising dividends and higher earnings lead to a higher stock price.
Analyzing The P/E Ratios
As mentioned earlier, you need to compare a stock to other stock within the same sector or industry to see if there is overvaluation or undervaluation. Stocks with smaller businesses make up industry groups, and industry groups make up sectors. In most cases, industry groups get benefits during a specific phase of the business cycle. Hence, many professional investors concentrate on an industry group when their turn is over in the cycle. Keep in mind that the P/E is the measure of earnings that you expect. When economics mature, inflation rises. As a result, the Federal Reserve enhances interest rates to slow down the economy and yield inflation to prevent the rapid rise in prices.
Some industries perform well in this environment. For example, banks earn more income with the rise of interest rates because they can charge higher rates on credit products like credit cards and mortgages. It is the same for basic materials and energy companies because they also receive a boost of earnings due to inflation because they charge higher prices for the commodities that they harvest.
On the contrary, interest rates usually go low and banks earn less revenue toward the end of an economic recession. However, consumer cyclical stocks have higher earnings usually because more consumers may wish to purchase on credit cards when the rates are low.
There are many scenarios where the price to earnings ratios of stocks in a particular industry has probabilities to rise. An investor may look for stocks within an industry if he/she expects to benefit from the economic cycle. The investor can find the companies that have the lowest P/E ratios and determine the most undervalued stocks.