
The S&P 500 index surged to a record high, helped by several catalysts. The index closed at $4,450, which was 102% above the lowest level in 2020. It has risen by more than 21% this year alone, and its total returns, including dividends, have been significantly higher.
Strong earnings
The S&P 500, Dow Jones, and the Nasdaq 100 indices have jumped this year because of the strong quarterly results. According to FactSet earnings insights, 59% of all companies in the S&P 500 index had published their actual results by Friday last week. Of these firms, 88% reported strong revenue and earnings surprises.
This week, some of the biggest firms in the US published strong results. For example, on Thursday, General Motors reported an operating profit of $4.1 billion and more than $8.5 billion for the first half of the year. It expects a second-half year revenue of more than $9 billion even as the chip shortage continues.
Meanwhile, Zillow, the housing technology company, published strong results, helped by its iBuyer program. The firm made more than $1.3 billion in the second quarter, bringing its total gross profit of $588 million. This is notable because Zillow is often used as a gauge for the US housing market.
Other firms that reported strong quarterly results this week were Roku, Etsy, and Costco. Meanwhile, last month’s results from key banks like Goldman Sachs, Morgan Stanley, and JP Morgan were relatively strong.
Most importantly, technology companies like Google, Microsoft, and Apple reported strong results. The four biggest companies reported a net income of more than $70 billion in the second quarter. This was an important thing since these firms have the biggest weighting in S&P 500.
Infrastructure week
The S&P 500 index also rallied as investors focused on the so-called infrastructure week. American politicians continued to deliberate on a $1 trillion infrastructure bill that will see the country build bridges, roads and boost broadband access. While this deal is smaller than expected, it will benefit several key firms in the index.
However, there are several challenges to the bill. The most notable one is a report by the Congressional Budget Committee (CBC) that estimates that the bill will lead to a $256 billion national deficit, the highest in a decade.
This goes against what the Senators who created the deal have promoted. They said that the plan would be paid for by repurposed funds from the previous stimulus packages and a streamlined tax process. Therefore, there is a possibility that some Republicans will oppose the bill for its deficits.
Meanwhile, the S&P 500 has rallied because of the rising number of Delta variant cases. While the cases are bad for companies, investors see something positive. It means that the Federal Reserve will maintain its easy-money policies for longer than expected. On Friday, the US is expected to publish relatively weak jobs numbers.
S&P 500 technical analysis
The daily chart shows that the S&P 500 index has been in a strong bullish trend recently. Along the way, the index has moved above the 25, 50, and 100-day Moving Averages, while the MACD has jumped above the neutral level. The index has also formed a narrow ascending channel.
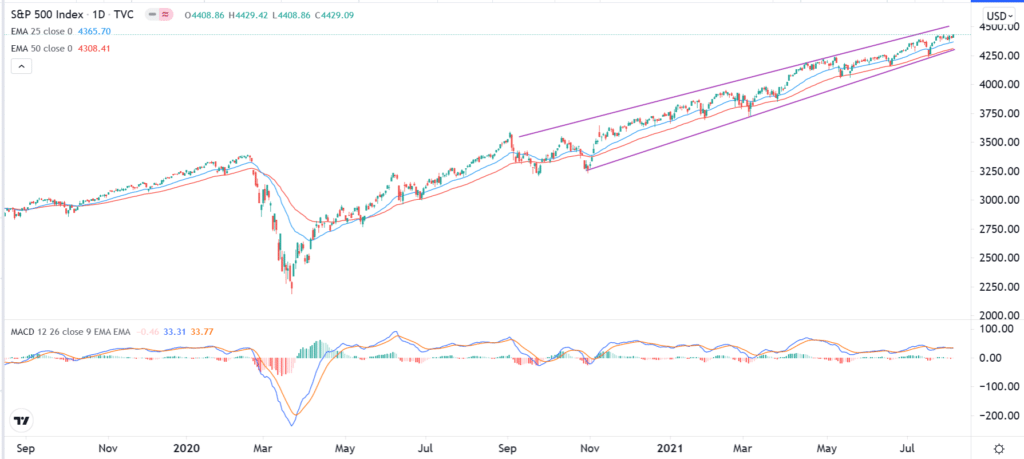
Therefore, the index will likely keep rising as bulls target the next key resistance level at $5,000. This view will be invalidated if the price drops below $4,000.