
Breadth indicators are important tools used mostly in the stock and indices market. They generally measure the amount and depth of participants in the financial market. For example, in theory, if 400 stocks of the S&P 500 are rising, it means that the rally is strong. In this article, we will look at some of the best available breadth indicators and how you can use them in day trading.
Advance/Decline Line
The Advance/Decline Line, also known as the ADL Line, is a technical indicator that looks at the number of advancing (or rising) stocks and compares it with those that are declining. The line is therefore drawn by subtracting the gainers and the losers. As a result, it will be positive when the number of advancing stocks are more than those that are falling.
Calculating the ADL Line is relatively easy. The first part is to find the net advancing stocks in a certain period. The next ADL values will be derived by using the figure for the previous period.
If the stock index is rising and the ADL is also rising, it means that the strength of the rally is relatively strong. If the ADL moves sideways, it means that there is an equal balance between bulls and bears. Finally, if the ADL is falling, it means that more stocks are falling. This can be a sign of more weaknesses to come.
Most importantly, when the stock market index is rising, and the ADL line is falling, it is a sign of divergence. This means that while the rally may continue in a while, there is also a possibility of a bearish reversal. Similarly, when the stock market index is falling, and the ADL line is rising, it is a sign of divergence, which means that the index could rebound.
A good example of the Advance-Decline Line at work is shown in the one-year S&P 500 chart below. As you can see, the ADL line dropped hard during the great sell-off of 2020 and then started rising in the following months. As it dropped, it signaled that more stocks were falling and vice-versa.
ADL line example

Arms Index (TRIN)
Arms Index, also known as the Short-Term TRading INdex (TRIN), is another relatively popular breadth indicator. The index is calculated by dividing the advance-decline ratio by the advance-decline volume ratio. The goal is to consider the number of advancing and falling stocks and the underlying volume.
To starters, volume refers to the size of trades going on in a particular stock. For example, a $10 million stock purchase will carry more weight than a $2,000 purchase.
The TRIN is calculated in a relatively simple way. You first divide the advances and the declines and then the advancing volume and the declining volume. You should then find the result by dividing the two. In most cases, the TRIN indicator is usually reflective of the S&P 500, but it is possible to calculate one by using other indices like the Nasdaq 100 and DAX index.
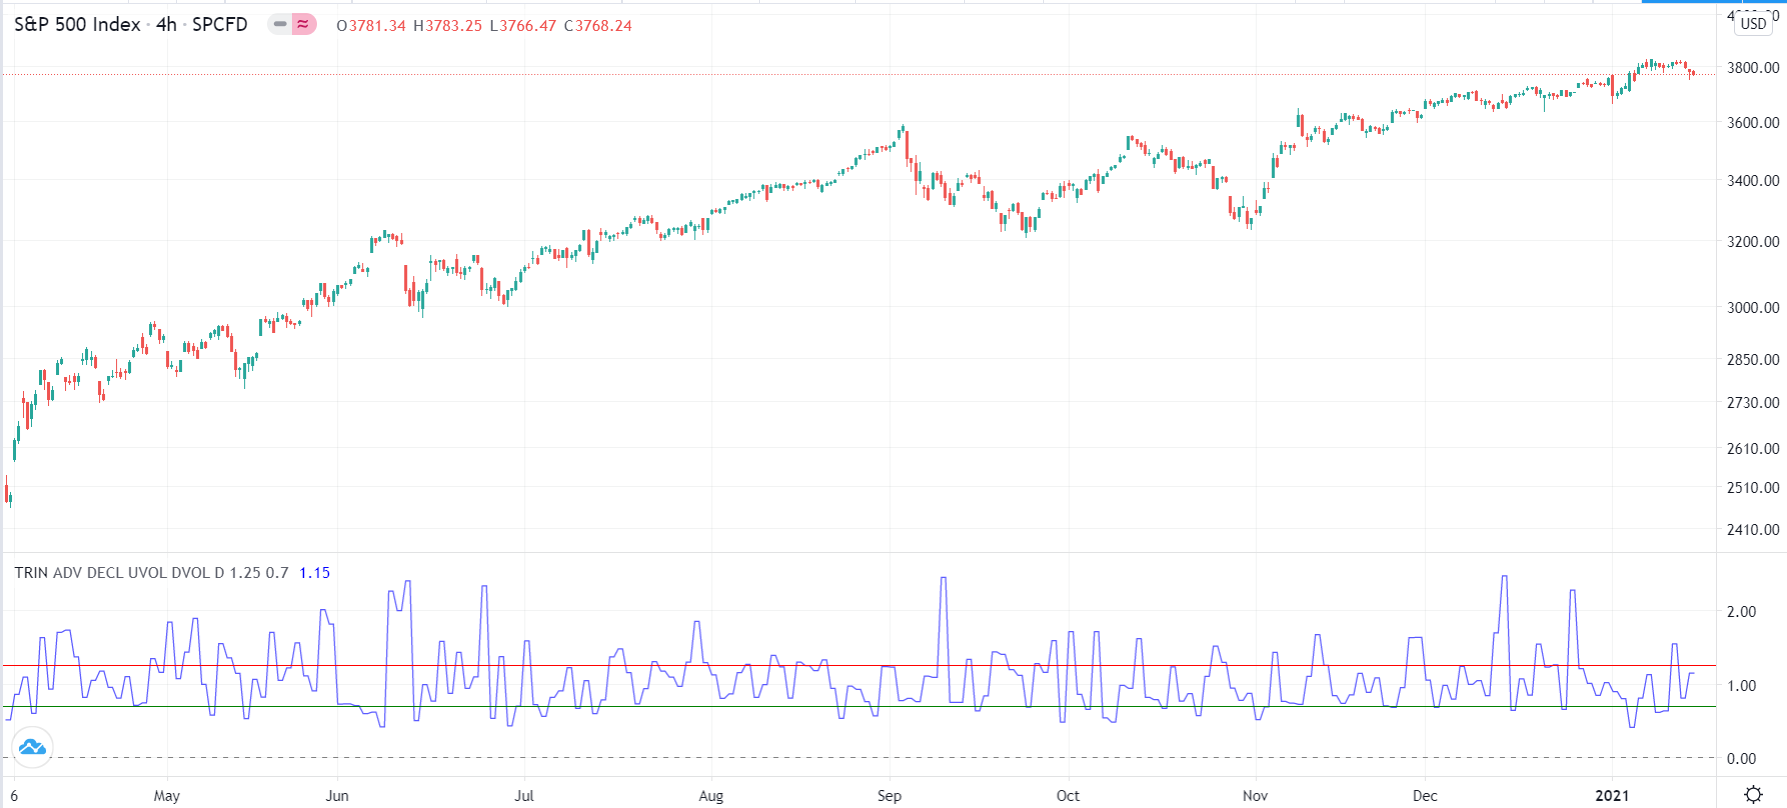
In TRIN, the figure will be below one when the volume ratio is bigger than the AD ratio and vice versa. A strong rally will always lead to a low TRIN figure because the rising volume overwhelms the falling volume. In other words, when stocks are having a great day, it means that the TRIN figure will fall. Meanwhile, when they are having a bad day, it will rise. However, as you can see below, the TRIN indicator can be relatively difficult to use in the market.
TRIN example
McClellan Oscillator
The McClellan Oscillator is a popular breadth indicator that was developed by a father and daughter team. It is calculated by looking at the net advances, meaning the number of stocks that are rising in a certain period and declines, which are stocks that are falling.
The difference between the McClellan Oscillator and the ADL Line is that the former incorporates the concept of the exponential moving average (EMA). The team behind it found that the 39-day and 19-day EMA were the ideal figures.
Another derivative of the McClellan Oscillator is the McClellan Summation Index. This is calculated by adding the totals of the MO figures.
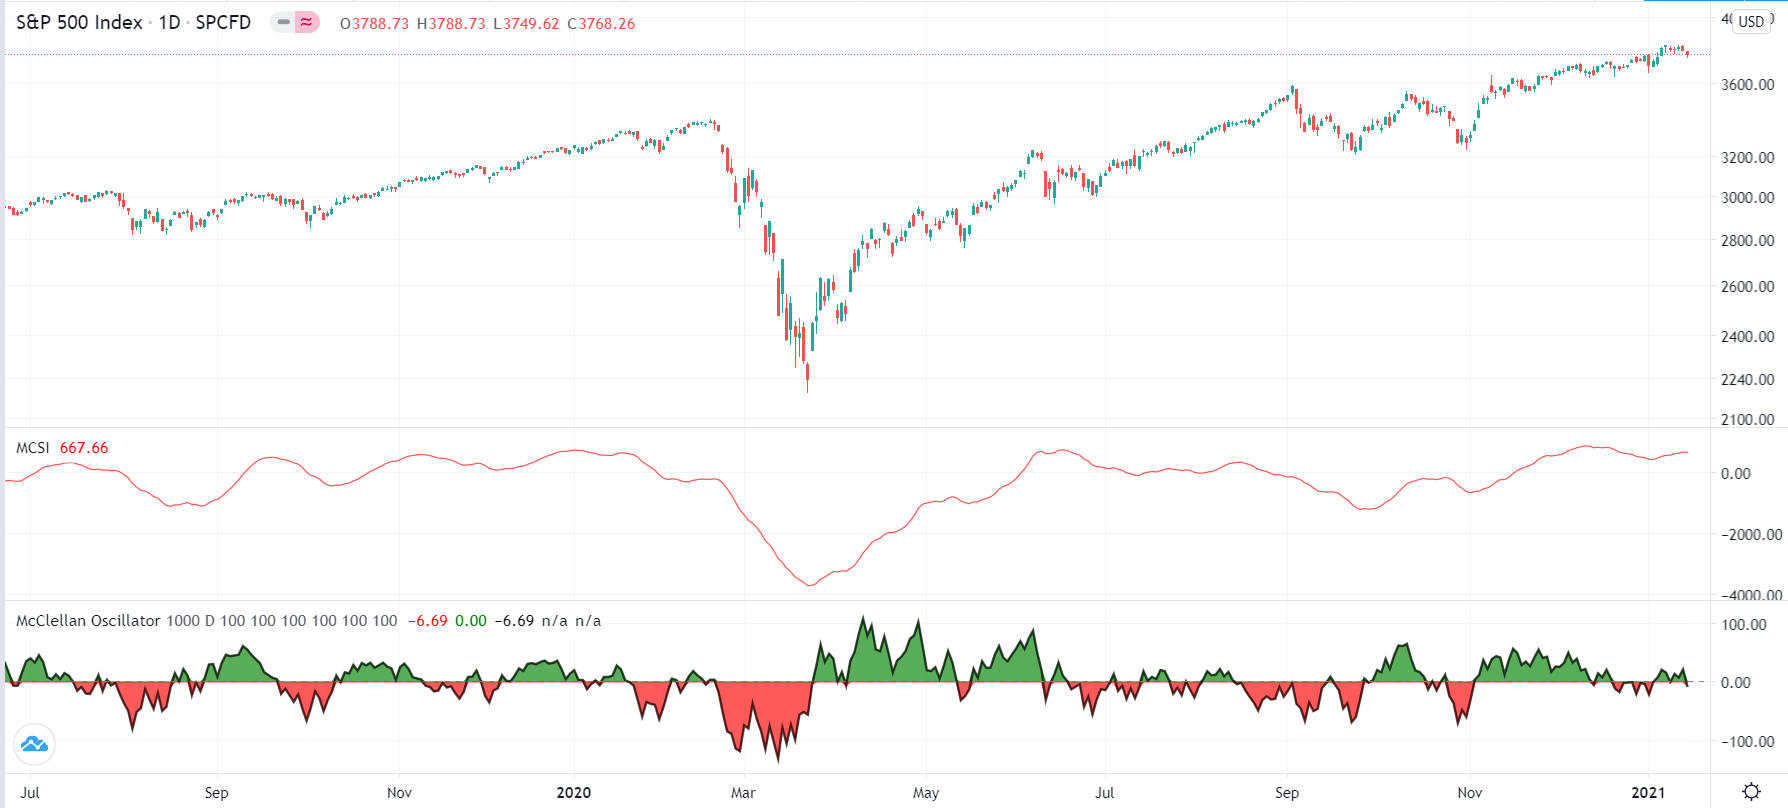
The chart below shows the one-year S&P 500 chart with the McClellan Oscillator and the MO Summation Index. With the MCSI, you see that it dropped sharply during the sell-off and then started rising as the S&P 500 recovered. In the same period, the MO turned red and spent most of its time in the green as the S&P 500 recovered.
McClellan Oscillator and MSummation Oscillator example
On Balance Volume (OBV)
The On Balance Volume (OBV) indicator is a breadth indicator that measures the performance of a financial asset. It does this by adding the amount of volume in up days and subtracting it from the volume-down days.
In general, there are three main approaches to the OBV indicator. If the asset’s price closes above the previous close, the OBV will be the total of the previous OBV and the current volume. If the price closed below the previous day’s close, the OBV will be the previous OBV minus the current volume. Finally, if the closing price is equal to the previous close, the OBV will be equal.
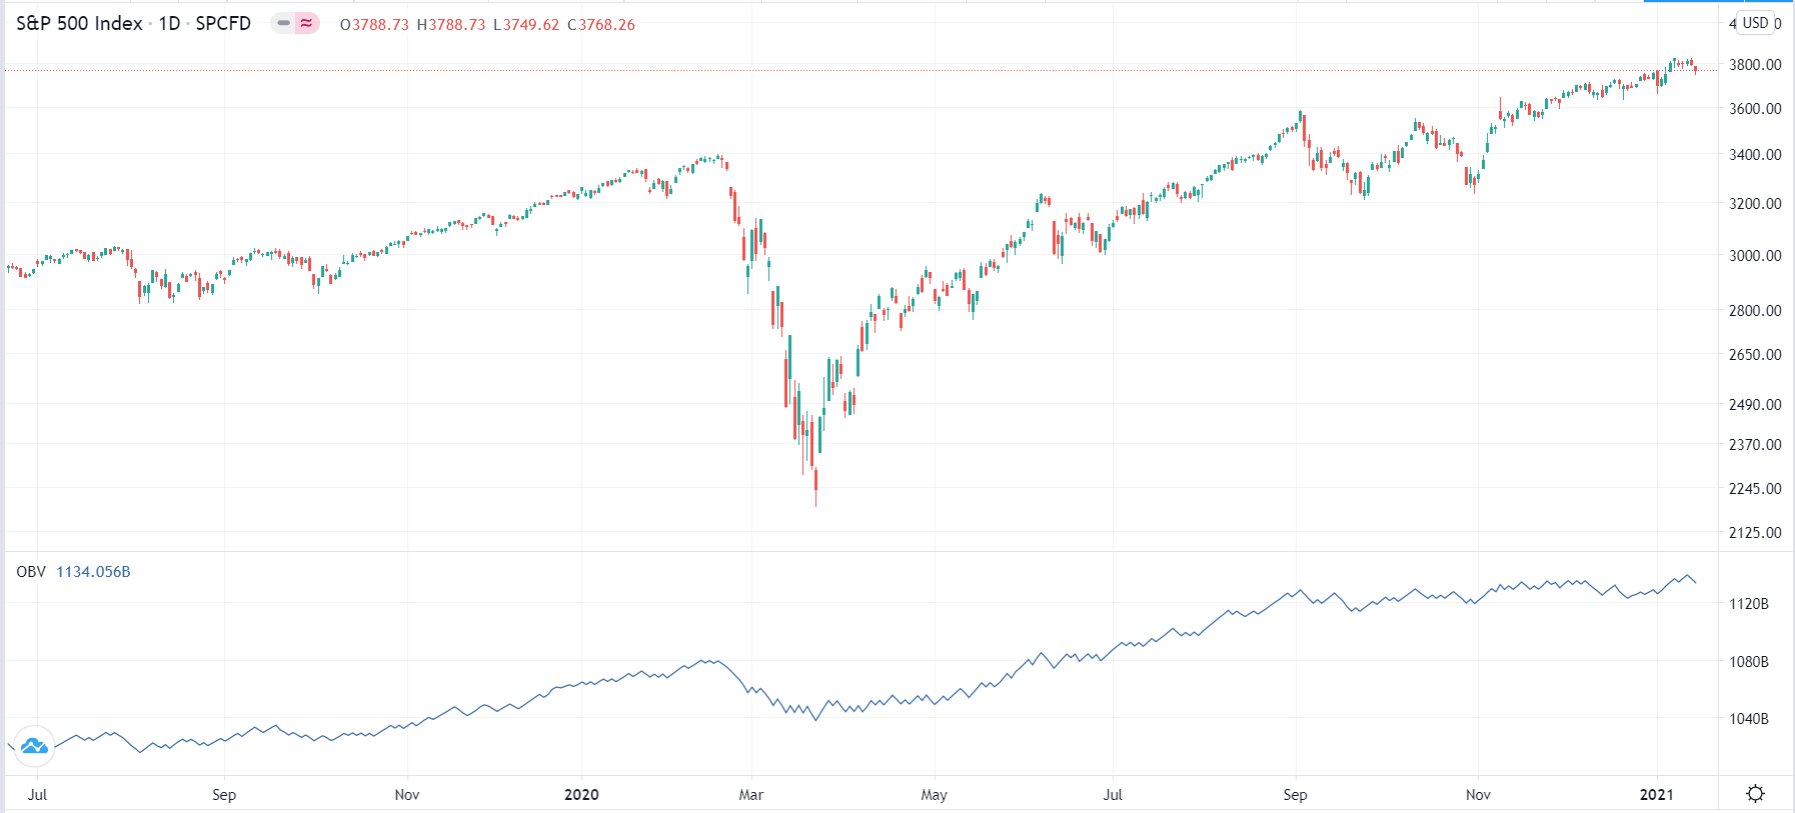
Ideally, the OBV will fall during periods of high sell-offs and then rise during a bull market. Therefore, it can be used as a way of measuring divergence. This means that if the OBV is falling while the asset is rising, there is a possibility that the price will start to fall.
On Balance volume example
Final thoughts
Breadth indicators are important technical indicators because they measure the level of participation in the market. They differ from other indicators like the Relative Strength (RSI) and Bollinger Bands because of the assets they analyze. In fact, some of the indicators we have looked at can only be used to analyze indices.
However, as seen, the indicators don’t necessarily tell you when to buy or sell, meaning that they are not ideal for day trading. Instead, they give you a broad picture of what is happening in the stock market.