
Most crypto traders tend to rely heavily on technical analysis to time their entries in the market. While there is nothing inherently wrong with this approach, it raises the question of what’s the best timeframe for your charts. Some traders rely on a single timeframe for both identifying trends and timing their entries and exits. However, in so doing, they run the risk of not seeing the whole forest through the trees. Instead, it is much more prudent to utilize a multiple time frame analysis.
What is multiple time frame analysis (MTFA)?
MTFA is the process of analyzing the same asset under different timeframes. Usually, it entails using longer timeframes to identify the overall market trend and obtain a trading bias, then narrowing down to a shorter timeframe for entry and exit signals. This technique can be applied to stocks, commodities, and FX, but it is best suited for cryptocurrencies.
Perks of MTFA
This analytical method has several advantages. For one, it helps a trader gain different views on the market. By using a longer timeframe, you can identify prevailing trends and reversals, if any. This can help inform your trading decisions.
Secondly, MTFA helps one filter out less probable trades. For instance, if you identify the overall trend is bullish, you can avoid shorting the asset, as any downtrends are likely to be short-term retracements. This method can also help you identify valid levels of support and resistance. These levels may not manifest as clearly on a shorter timeframe chart as they would on a longer timeframe. This can help you avoid trading around certain levels that prices may struggle to break past.
MTFA also helps to spot trend changes sooner. By relying solely on a longer timeframe chart, you may be late to the party in identifying a trend reversal. However, if you check the shorter timeframe chart, you can notice the reversal as it happens and adjust your trades accordingly. This can help you get better entries and exits for your trades, translating to better profit margins.
How MTFA works
In essence, multiple time frame analysis is a three-step process. These steps are listed below.
- Identify the prevailing trend on the longer timeframe chart.
- Filter signals from the shorter timeframe chart in the direction of the prevalent trend.
- Enter trades in the trend’s direction.
Best timeframes for trading crypto
The best timeframe for your crypto trades will depend on what kind of trader you are. You may prefer long-term trading (HODLing), or you may be a short-term trader. As a rule of thumb, you want the longer timeframe to be 4 to 6 times longer than your shorter one. This is broken down in the table below.
| Longer timeframe | Shorter timeframe |
| Weekly | Daily |
| Daily | 4-hour |
| 4-hour | 1-hour |
| 2-hour | 15-minute |
| 30-minute | 5-minute |
MTFA for day traders
Day trading involves entering and exiting trades within the space of a day. Thanks to the crypto market’s volatility, this strategy has oftentimes proved profitable, hence its popularity. Most likely, day traders will utilize the 30-minute chart to obtain a trading bias, which means they’ll use the 5-minute chart for obtaining trade signals.
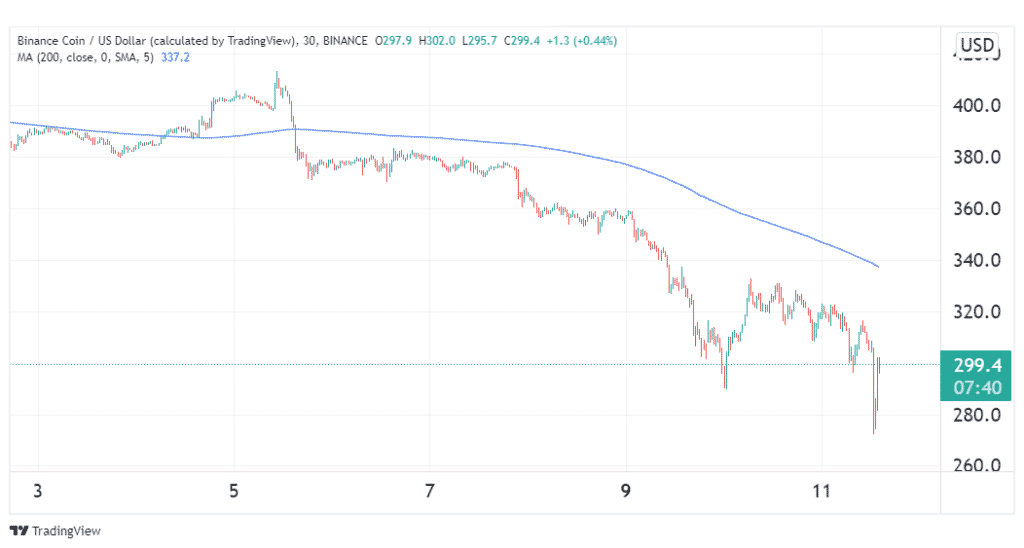
The image above shows a 30-minute chart for Binance Coin (BNB). Applying a 200-period Simple Moving Average, we observe that the coin has been in downtrend since the early days of May. Therefore, we will be looking to enter short trades when the chance presents itself. For that, enter the 5-minute chart.
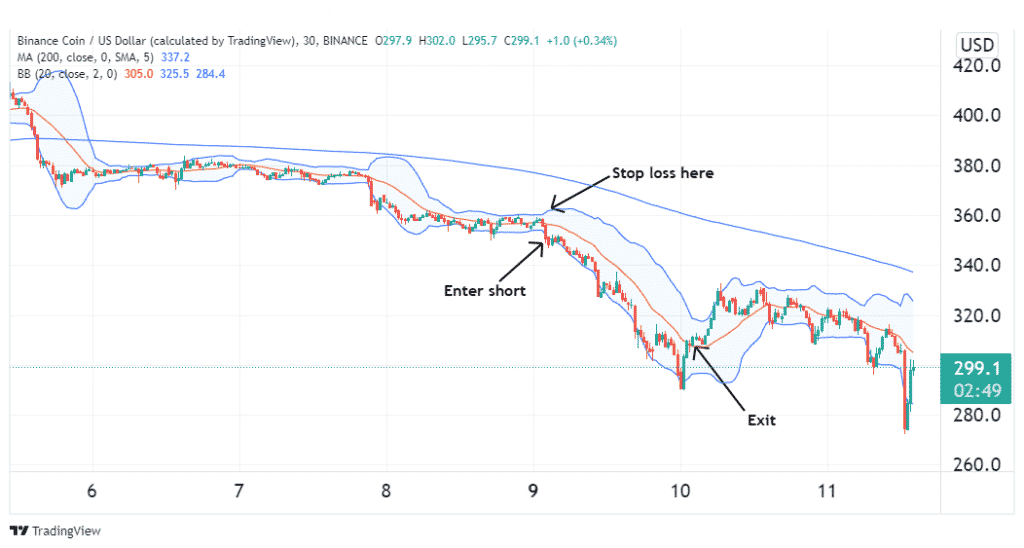
In the illustration above, we added the Bollinger Bands indicator to the 5-minute BNB chart to help provide entry and exit signals. On 9th May, prices hit the lower band of the indicator to trend against it, which is a bearish flag. This provided the entry for our short trade. A suitable stop loss would have been at the upper Bollinger band. At around midnight, prices broke above the middle band, which marked the exit of our successful short trade.
MTFA for HODLers
HODLers is another class of crypto traders who prefer to buy coins and hold them long-term in the hope that they’ll rally significantly over time. Since such traders may end up holding their coins for years, they could utilize the weekly chart to obtain a trading bias as they are not interested in short-term fluctuations. They can then use the daily chart to look for instances when the coin is oversold, which will provide them with an opportune entry. This is illustrated below.
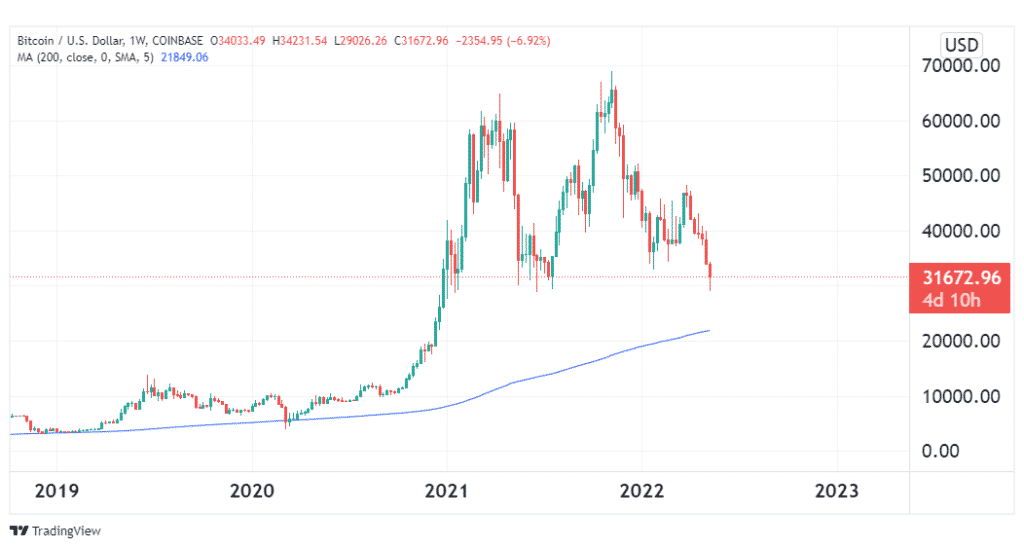
The illustration above shows a weekly Bitcoin chart. The coin has been in an uptrend, as it has been trending above the 200-period Simple Moving Average. This is expected due to its deflationary design. Therefore, we expect that in the future, as its demand grows and supply remains stagnant, prices have nowhere to go but up. However, we still need to time the ideal entry position when a market correction is in place. Enter, the daily chart.
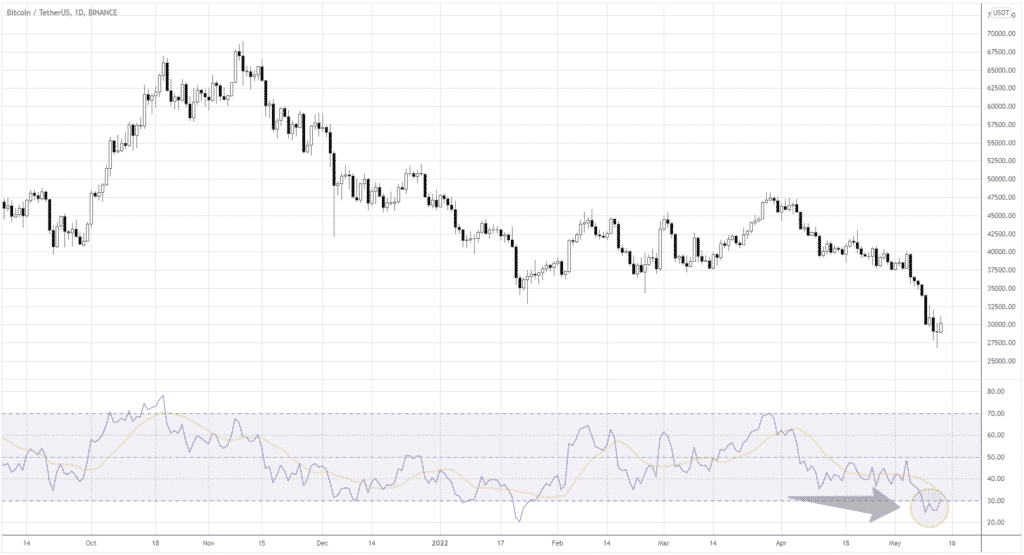
From the daily chart, the RSI showed that BTC was oversold on 9th May. This was the signal to buy the coin and HODL. However, keep in mind that it is not uncommon for the market to correct 80% or more. Even when holding for the long term, it is prudent to lock in some profits once in a while.
Conclusion
Most crypto traders rely on technical analysis to inform their trading decisions. However, this raises the question of which timeframe is best for their charts. The best approach entails using a longer timeframe chart to identify market trends and provide you with a trading bias, then narrowing it down to a shorter timeframe chart for entry and exit signals.