
Every investment carries with it some risks. It’s a common notion in the market that if you embrace uncertainty and take calculated risk, you are at a position to earn great returns. But how can you estimate the returns you will earn after investing in uncertainty? Here’s where the Capital Asset Pricing Model comes to your rescue. Read on to understand the model and how you can use it.
What is the CAPM?
The higher the risk, the more an investor expects to earn. The Capital Pricing Model helps define the expected ROI from assets when you invest in some systematic risks. Traders and analysts use the model along with other methods of analysis to arrive at investment decisions. If you are to evaluate expensive and risky securities in a competitive market, you can estimate the ROI for those assets after assessing the risk and capital costs.
The CAPM model was devised by William Sharpe, Nobel laureate and economist, in 1970. He based the model on systematic risks, which define market risks that the diversification of a portfolio can’t reduce, such as recession, wars and interest rates.
How Does it Work?
Widely used in the financial market, the CAPM is based on the idea that the returns should be higher for a riskier investment. This justifies the presence of a variable dimension called the market risk premium. The mathematical formula for the calculation of returns is –
Expected Return = Risk-free rate + (Beta * Market risk premium)
To decode the formula into simpler mathematical notations –
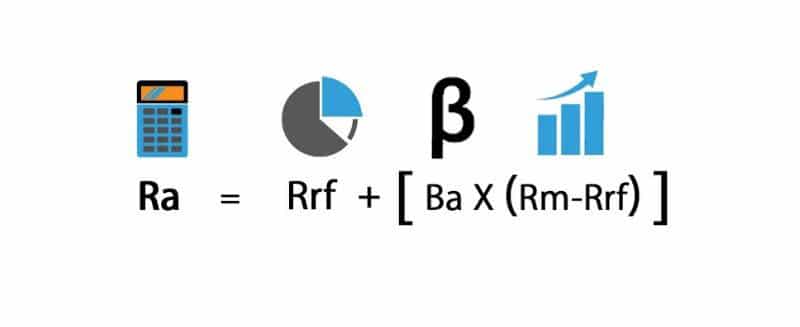
where,
Ra – Expected return on a security
Rrf – Risk-free rate
Ba – Beta of the security
Rm – Return expected from the market
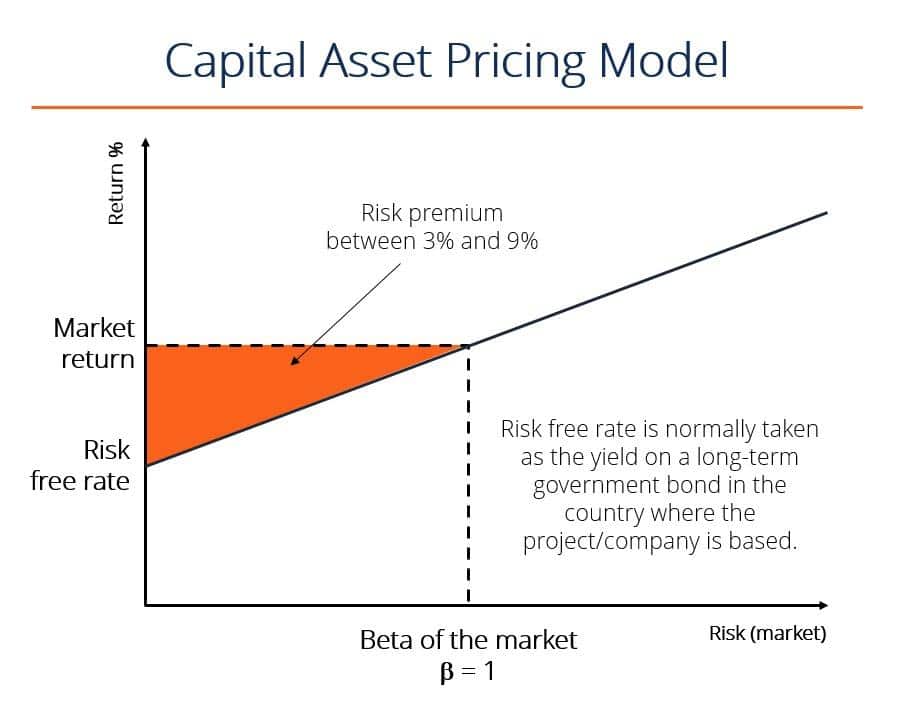
The risk premium compensates the systematic risk or non-diversifiable risk. A risk premium has a rate of ROI exceeding the risk-free rate – it is the difference between the expected market ROI and the risk-free rate. This is explained in the figure below –
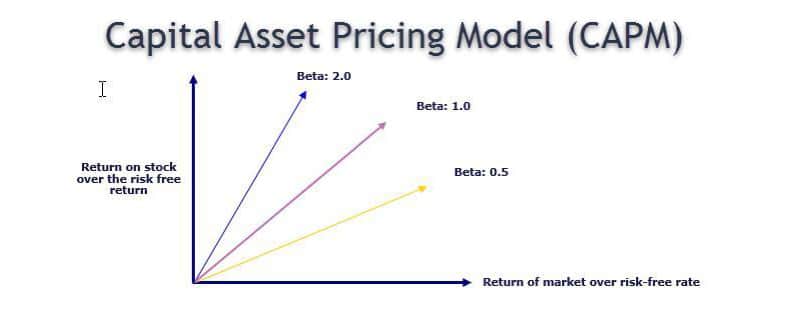
The role of beta
IN the formula for CAPM, beta is the coefficient multiplied to equity risk premium rate. This allows you to measure the risk associated with a stock. It reflects the change in price from high to low and vice-versa of a commodity in the market. With the value of beta, stock investors can gauge the volatility and sensitivity of the stocks.
For instance,
- When there is no difference between the share price and the market’s price, the value of Beta is 1.
- If the value is 1.5, the stock value of a holding rises by 15% while the market value sticks to 10. This is easy to establish from the formula.
- Similarly, due to higher risks, the stock value crashes by 15% when the market value falls to 10%.
- When Beta = -1, security possesses a contradictory relationship with the market.
This is demonstrated in the diagram below –
The risk is considered profitable because (as per the formula), the higher the risk premium, the greater the ROI and your earnings. When investors invest in a risky market policy, they look forward to higher gains. They need an extra ROI beyond the general risk-free rate to compensate and attract them to put their money into something. This additional ROI is the market risk premium and it’s what makes uncertain probability so profitable.
To understand the model in action, let’s say that there is a stock valued at $100 per share that pays an annual dividend of 6%. It is a risky stock with a beta value of 1.5. The risk-free rate is 6%, and the market rise is 10% p.a. You can estimate the CAPM in the following way:
Since, Ra = Rrf + [ Ba * (Rm – Rrf)]
So, Ra = 6%+1.5×(10%−6%)
or Ra = 12%
According to the CAPM, an investor can therefore
expect an ROI valued at 12%.
How Effective is It?
The CAPM has found importance in the world of financial modeling because of a few key reasons. You can use the formula to compute the cost of equity to estimate the weighted average cost of capital. You can use WACC to estimate the Net Present Value (NPV) of all future stocks and estimate enterprise and equity value.
Despite all uncertainties, investors look forward to lucrative opportunities to invest and earn more returns. A lucrative investment may have a high-risk factor where the CAPM can help you to evaluate whether it is prudent to invest or not. As an investor, you can use the CAPM to estimate and justify the price, compare it with market values, and make an informed decision based on the company’s past performance.
If you dread complex calculations and balance sheets, the CAPM presents an easy way to estimate whether to go for the option or not. The two main factors that make CAPM attractive to investors is that it helps to calculate the expected returns in a fairly easy manner.
That being said, there are some pitfalls of using the model as well. Some critics have shared views that the CAPM model makes unreliable assumptions. Moreover, the value of Beta also poses an issue since it does not depict the risk associated with the rise and fall of stock prices. If you use the CAPM model, you may ignore the fact that risk and returns have an uneven distribution for a chosen time frame. Additionally, an ideal case where the risk-free rate is constant does not happen in reality – changes in interest rates happen every other day, which you may not consider in our calculations.
Final Thoughts
Experts argue that the CAPM is founded on unrealistic assumptions. However, even though the CAPM has its own pitfalls, it remains as a key tool used by investors for making trading decisions. Due to the realistic results and the ease of use of the formula, investors still use it jointly with other forms of analyses to assess risk. Nevertheless, if you are searching for an easy way to determine whether an investment is worth it, you can surely give it a shot.