
An investor who intends to buy or sell a company’s stock will first need to assess earnings to evaluate the financial standings.
Important aspects include assets/liabilities analysis, revenue collected over a particular period (monthly, quarterly, or annually), equity, and even profitability. One can find details in balance sheets, income/cash flow statements, and annual reports. It is vital to assess the quality of these details before investing.
Identifying guidelines
Investors should be wary of analytical misconceptions in financial reporting in this accounting age that may skew the company’s correct position. The following criteria will allow an investor to make informed decisions before investing.
- Net income inconsistencies
Net income is calculated by first subtracting the total revenue (in the period in question) with the total expenses and the business operating costs (BOCs). Government tax is also deducted from the residual amount to get the net income.
In general, the net income has to be computed from an increase in sales and a decrease in operational cost. An increase in cash should necessitate a decrease in costs.
When a high cash flow does not follow the high income balance, the investor should flag the situation as a potential risk.
However, it is vital to note that cash flow is slightly different from net income. A company may have a lower cash flow and higher net income due to the time difference in making payments. The company may document sales whose payment may not be due by the time of reporting.
For example, an investor may consider Amazon Inc. (AMZN) before investing. A three-year assessment of the net income/operational cash will reveal the following graphs.
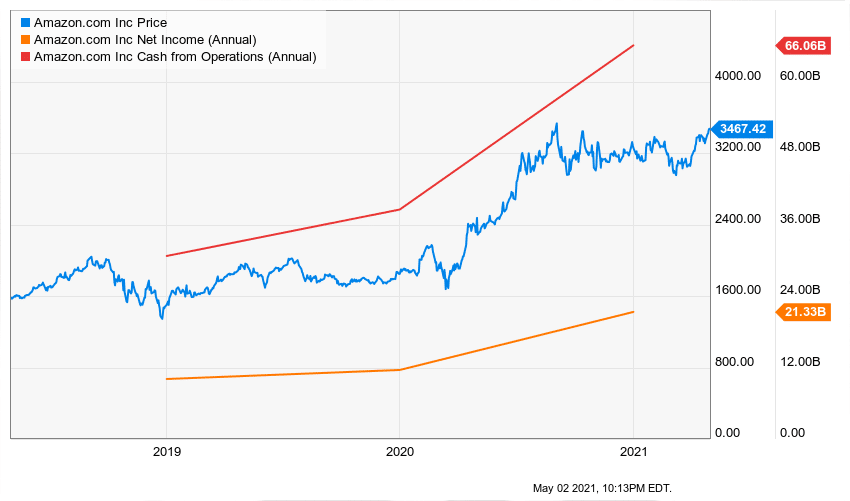
Figure 1: 3-year analysis of Amazon Inc. (AMZN)
Over the three years, Amazon’s share price has increased to $3,467.42 (+119.1%), net income to $21.33 billion (+111.8%), and cash from operations to $66.06 billion (+115.0%).
In this analysis, the investor is certain that Amazon’s gain in net income has been commensurate with its cash flow over the three years.
The cash-flow statement can be analyzed from financing and investing dockets in deepening understanding of the capital operations of the company. Any inconsistency between these two criteria will help the investor to avoid or control investment.
- Earnings per share manipulation
Earnings-per-share (EPS) is the ratio of the profits of a company allocated to the shareholders. It is calculated by dividing the net profits with the equity/outstanding shares.
For instance, if a company has 100,000 shares and it earned a profit of $1 million, the earnings-per-share (EPS) is $10.
One crucial fact is that if the company under analysis pays dividends to its shareholders, the dividends are first subtracted from the profit before the EPS calculation.
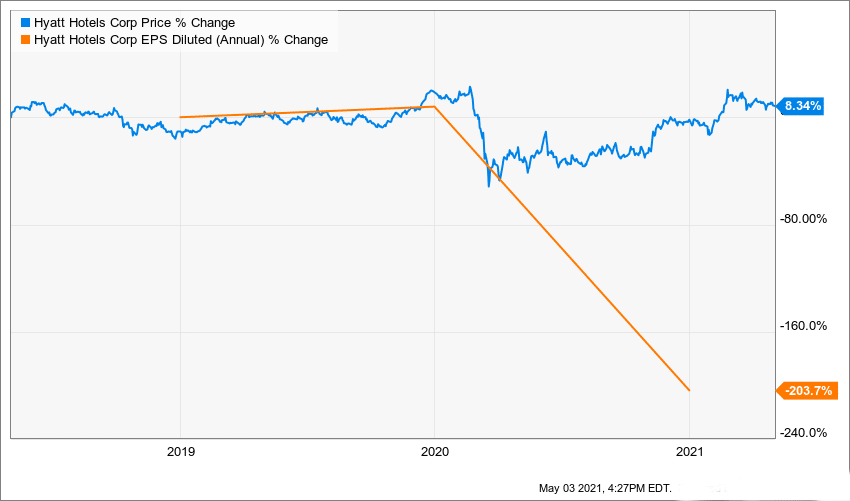
Figure 2: EPS analysis on Hyatt Hotels Corp (H)
The EPS analysis of the Hyatt Hotels Corp (H) indicates that the company shed 203.7% of its EPS in the three years leading to 2021 to -6.93. The company’s share price stood at $81.94 as of May 3, 2021, rising by 8.34%.
Gross profit had also declined 100.1%, while net income was down 191.4%. This understanding is essential since EPS involves profit/net income analysis. If the income was low against the EPS, it would signal a red flag on its EPS statement.
- Price-to-earnings ratio
The price-to-earnings (P/E) ratio is the amount of money invested against the EPS. It is calculated by dividing the price of the stock by the EPS. It shows the dollar value investors are willing to part with to share in the company’s earnings.
P/E ratios are also essential marks to show if investors prefer the idea of the company’s acquisitions. If the PE ratio is low in a buyout scenario, the investor should be wary of the company’s prospects.
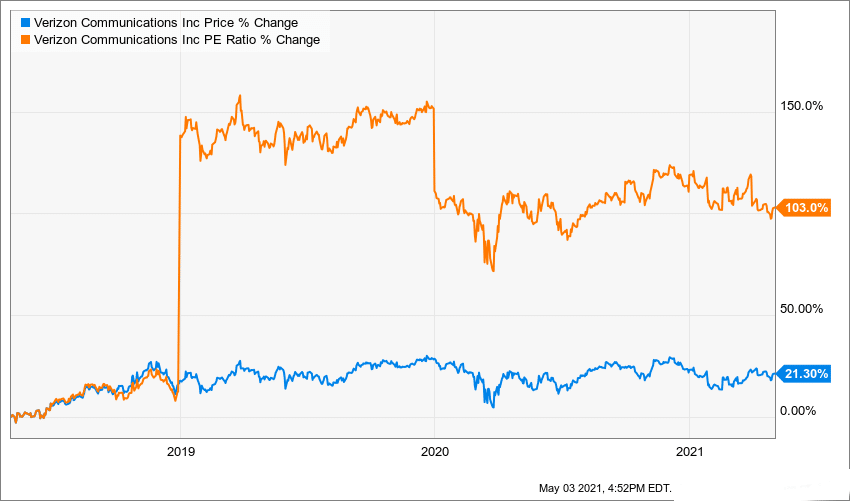
Figure 3: Verizon Communications Inc. (VZ)
As investors would know, Verizon Communications (VZ) is on the verge of a buy-out with Apollo Global Management (APO.N). An investor would do well to view how other investors are cashing in on this sale. A look at the PE ratio shows that the ratio has risen 103.0% over the three years.
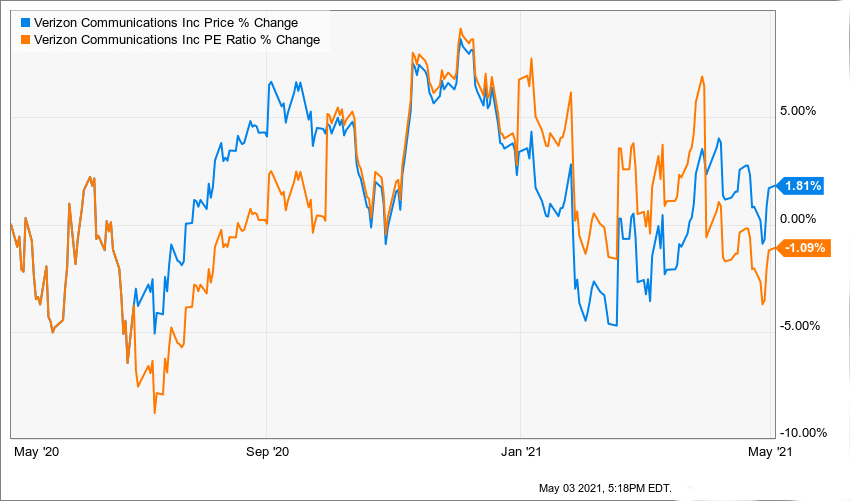
Figure 4: One-year analysis of the VZ PE ratio
However, in the annual analysis, the PE ratio declined 1.09% against a slight rise in the share price at 1.81%.
A negative PE ratio shows that the company has lost returns. In the case of Verizon Communications Inc., the company seriously needs Apollo to buy the assets. In a write-down indicated by VZ in 2018, the company declared as worthless assets valued at $4.6 billion.
As a rule, if the EPS increases against a decrease in the PE ratio, the company would be viewed as undervalued. In the case of VZ, the annual change in EPS remained 0.00% against a negative PE ratio at -1.09%.
The company may decide to engage in stock repurchases to increase its value. Such a condition is dangerous to investors, especially if the company increases its debt balance to finance its stock repurchase program.
An increase in stock purchases would give the impression that the company’s value has increased. Investors need to consider how companies are conducting their stock repurchase programs.
Proper representation of expenses, inventory costs, and capital structures should be indicated in the balance sheet. Check the footnotes to understand the company’s additional information in the balance/income statement or the SEC filings.
Conclusion
Investors should understand that they will have a share in the company’s profits or losses once they become involved in the daily operations. To understand the value of the stock, one should assess the earnings. Income statements impact the price of the stock.
Financial statements can be manipulated to raise the stock’s price against dwindling profit margins. Correct representation of company facts coincides with the particular elements of the income/profit statement of the company.