
You may have an idea of how to exploit the crypto market for profit. However, without proper testing, your idea may prove to be a loss-maker when applied to real-time trading. To prevent this, you should perform a backtest before investing money in your strategy.
Backtesting involves testing out your strategy on past price charts to find out whether it would have been effective on them or not. It works on the premise that a plan that was effective in the past is more than likely to work in predicting future price moves.
Importance of backtesting
The backtesting process can be tedious, time-consuming, and even expensive in some cases. However, it is necessary because it provides you with an avenue to evaluate your analytical methods and optimize them where need be. If your methods fail to work in the testing stage, chances are they won’t work in live markets, and you will have saved yourself from further loss. On the flip side, if they work, you can be confident that they will return a profit when it comes to actual trading.
Backtesting prerequisites
Before we tackle the backtesting process, it is time for some introspection. Basically, there are two types of crypto traders, and you need to figure out where you fall. These types are discretionary and systematic traders.
Discretionary traders trade on instinct. They evaluate current market conditions and use their judgment to enter and exit trades. These decisions may be influenced by a myriad of factors the traders know themselves. Since they do not have a strategy set in stone, it may be difficult to backtest their trading ideas. However, a backtest is still vital for such a trader, but the results it will yield will be less reliable.
Systematic traders will usually have a well-defined trading plan that outlines when to open and close trade positions. They only exercise control when formulating the strategy, but entry and exit signals are left exclusively to the strategy. Such strategies take the “if when” format, that is if X and Y happen simultaneously, open this position. When Z happens, close the position.
A systematic approach has the obvious advantage of eliminating emotional trading. However, the strategy has to be extensively defined; otherwise, it will yield inconsistent results.
A well-defined strategy can also be employed to an algorithm if you so prefer, which then runs your backtest over a predetermined period. Several such algorithms are available online, some for free and others for a fee. Alternatively, with some programming knowledge, you can write a backtesting program of your own using C++, R, MATLAB, or Python.
How to perform a manual backtest
To carry out this procedure, let’s use a Bitcoin example and use a strategy based on Moving Average crossovers. We shall define our strategy as follows:
- We are defining a long-term trading strategy; thus, our preferred chart will be the daily chart.
- Our entry signal will be a golden cross. This will occur when a 50-day simple MA crosses over the 200-day MA. At this point, we shall purchase one BTC.
- Our exit signal will be a death cross. This will occur when the 50-day MA crosses below the 200-day MA.
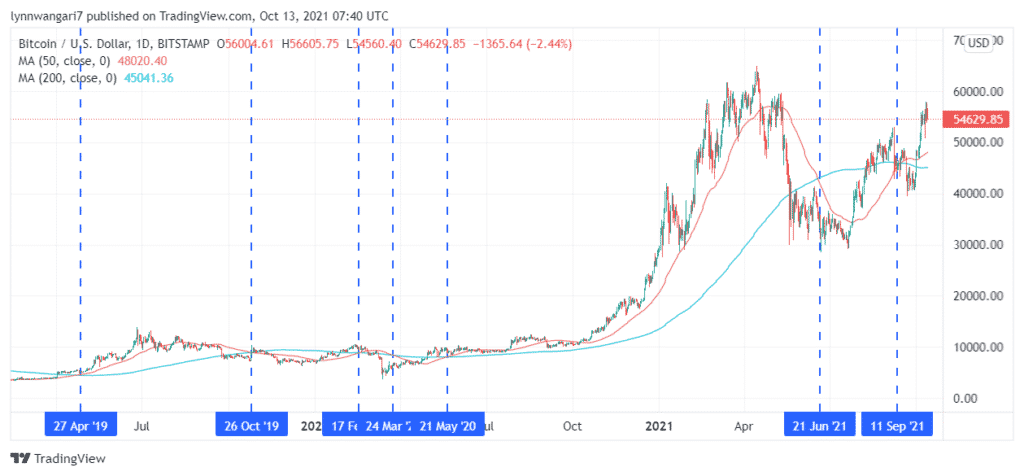
For our test period, we chose to begin from 2019. Feel free to scroll back further, as the more data you have, the more conclusive your results will be. The broken vertical lines in the above example represent the entry and exit signals that our strategy flagged.
The signals we obtained were as follows:
- 23rd April 2019: Buy at $5,523.
- 26th October 2019: Sell at $9,080.
- 18th February 2020: Buy at $10,193.
- 24th March 2020: sell at $6,766.
- 21st May 2020: Buy at $9,533.
- 19th June 2021: Sell at $35,462
- 11th September 2021: Buy at $47,026.
From the above signals, the first trade yielded a profit of $3,557, the second a loss of $3,427. The third trade resulted in a $25,929 profit. There is also a running trade currently at a $7,603 profit. We can choose to close this trade and tally the cumulative results, but that would beat the point of backtesting our strategy. For consistency, we should follow the strategy to the latter, and only close the trade at the next death cross.
Therefore, our P&L is currently at $26,059.
Evaluation of results
At face value, the results show that our strategy would have yielded a substantial reward had we put it into action back in 2019. From our initial investment, we grossed a 472% yield in a little over two years.
There was also a substantial loss recorded during this period, but that was due to the COVID-19 pandemic’s effect. If we had more data to analyze, we would have been able to determine whether such a loss is the exception to the rule or part and parcel of our strategy.
This kind of test can also highlight your maximum upside and risk and tell you how much capital you require to successfully run this strategy. From our findings, we can also calculate the gross return per year and the ratio of profits to losses.
To improve the quality of results obtained, you can choose to incorporate more indicators in your strategy. Alternatively, as aforementioned, you can use more historical data by starting off much earlier than 2019.
Conclusion
Backtesting refers to the application of a trading strategy to crypto price charts, beginning from a point in the past up to the present day. This is done to gauge the performance of such a strategy in the markets. Once it has passed this test, the strategy can then be applied to live markets.
These tests can be done either manually or autonomously using any one of several programs in the market. Alternatively, with some coding knowledge, you can write a backtesting program yourself.