
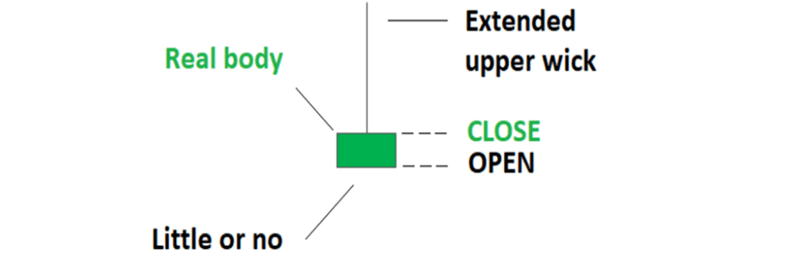
What is the inverted hammer candlestick?
This is a price formation used by traders to make decisions based on the fact that it communicates an impending bullish run. It is a distinctive candle with a long wick, measuring about two-times the length of the main body.
What does it signal?
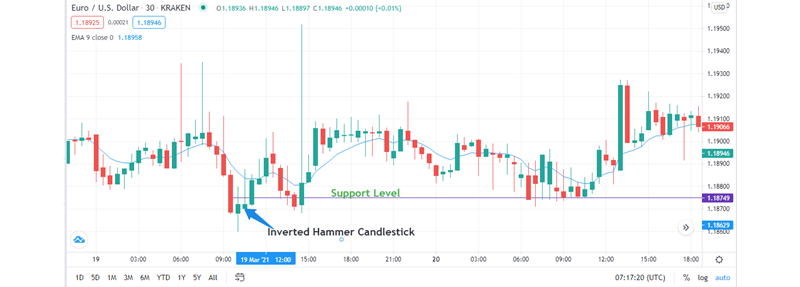
Generally, this tool communicates that the market trend is about to revert to an upward trajectory. However, it is prudent to wait for the confirmation or rejection of the subsequent prices before concluding whether a bullish reversal is in the works. Usually, the market is fast to react to the extended wick in the form of more increased purchases of the stock under focus.
Figure 1: The Inverted Hammer Candlestick
How to trade using the candlestick
- It tells you when to go long: It is a sign that the stock is rising in value and that you should buy it. Typically, traders go long when the stock is at or near the candlestick’s low price. It is prudent to wait for the confirmation prices, but this may result in marginal losses or reduced profits. Therefore, one must balance between the two by weighing the trade-offs.
- Can help you determine when to take profit: This tool is useful for short-interval trading, using a risk-reward ratio. This means that a trader can set the maximum amount they are willing to lose. Conversely, the risk-reward ratio is useful in determining the potential profits one stands to make.
- The risk-reward ratio is usually used in combination with the stop loss limit. For example, if you the risk-reward ratio is set at 1/2 and the stop loss limit is $50, then the trader has to take the profit once the price hits $100.
- Helps you settle on the appropriate price to limit losses: The inverted hammer gives traders a better understanding of the market when holding long positions. This is done by setting up a stop loss level, which is supposed to be put within two to three units of the inverted hammer candlestick.
Pullbacks in an Uptrend
Trading pullbacks in an uptrend is another effective way of trading with inverted candlesticks. An inverted hammer appearing on an upward trend usually signals a good opportunity to make a move on an impending pullback. Be sure to observe the following rules before getting on to a trade based on a potential pullback.
- Wait for the market to close above the candlestick before going long.
- Move in when candlestick is above your stop loss level.
- The 50 and 20 Exponential Moving Averages (EMA) should serve as your support points, using lower lows as well as higher highs to guide you. The two EMAs should be below these points.
- Ensure that the retracement is not directed towards the two EMAs.
Using the troughs to head up
A trendline’s two troughs can help you predict a looming bullish charge. The first step is to draw a line at the peak between the two troughs, with a neckline joining them. You should then place your stop loss should be placed just below the second troughs. If the price goes beyond the neckline, then you should take it as a signal to go long.
Limitations
While it is a valuable tool for forecasting bullish reversals, the inverted hammer has some weaknesses. These include:
1) At times, the inverted hammer may miscommunicate. The breakout may not last long and may therefore mislead traders into making ill-advised bullish moves. This is usually the case in instances where the buyers of a security have not gained enough traction to take on the pressure from sellers.
2) Effect of other market factors: there are also other fundamentals and indicators that may result in the reversal of established or impending price actions signaled by a single inverted hammer candlestick.
The bottom line
Trading with the inverted hammer candlestick is an effective way of making good returns. However, this tool needs one to be keen on market fundamentals and observance of strict discipline. The stop loss limit is an important tool to employ when using an inverted hammer candlestick. Importantly, this type of trade requires a non-emotional approach and may achieve mixed results, depending on the type of stock you are trading in.