• Best Managed Accounts
  • Best IRA Accounts
  • Best Forex Brokers
  • Best Forex Robots
  • Best Saving Accounts
  • Best Stock Brokers
  • Best Crypto Platforms
  • Best Crowdsourced Review Sites
No Result
View All Result
MFA
  • Top
  • Investing
    • Forex Trading
    • Stock Trading
    • Crypto Trading
    • Mutual Funds
    • ETFs Investing
    • Bonds Investing
    • Real Estate Investing
    • Investment Apps
  • Passive Income
    • Automated Trading
    • Managed Accounts
    • Passive Income Apps
  • Money Management
    • Banking
    • Savings Accounts
    • Money Market Accounts
    • Financial Advisors
    • Financial Independence
    • Saving Money
    • Paying Off Debt
    • Make More Money
  • Retirement
    • 401(k)
    • IRA
    • Retirement Planning
    • Retirement Calculator
  • Reviews
    • Online Brokers
    • Robo Advisors
    • Signal Providers
  • News
No Result
View All Result
MyFinAssets
No Result
View All Result
Home Investing Stock Trading

Candlestick Day Trading Strategies in Stocks

March 23, 2021
in Stock Trading
0
A A
0
Candlestick Day Trading Strategies in Stocks

Candlestick charts have been in constant use by investors for day trading in the financial industry. The participants who utilize them are also called technical traders. Day trading is an art in which a trader holds and sells securities within the same day. 

There are numerous benefits and demerits when you approach the markets in this manner. The most significant advantage rhymes alongside the disadvantage, which points to the risk and reward. While day trading stocks, you get in and out of positions with speed and frequently put your capital on the line.

Trade like pro, no experience needed
Best Managed Accounts 2022

Time frames

With day trading, you would want to stick with lower time frames as the higher ones are meant for swing or position trading. Use those between daily, H4, H1, M15, and M2 charts. As a technical trader, it is better to mark out potential support and resistance alongside key levels. 

You can also add moving averages to mark out trends and support and resistance levels. For our analysis, we will be using the 200 and 20 simple moving averages.

Types of candlesticks and how to use them in stocks

Big bars

We use the big or elephant bars that form in the first two minutes or the rest of the trading day. As soon as we spot a big green or red candlestick, we take the appropriate long or short positions. For additional confirmation, we hunt for stocks that are in oversold or overbought conditions.

SL: One cent below/above the candle.

TP: The next support or resistance, or new high.

We spot a big red bar at the start of the trading day at C. It has a good setup for a potential short where we take a sell with the stop loss above the red bar.

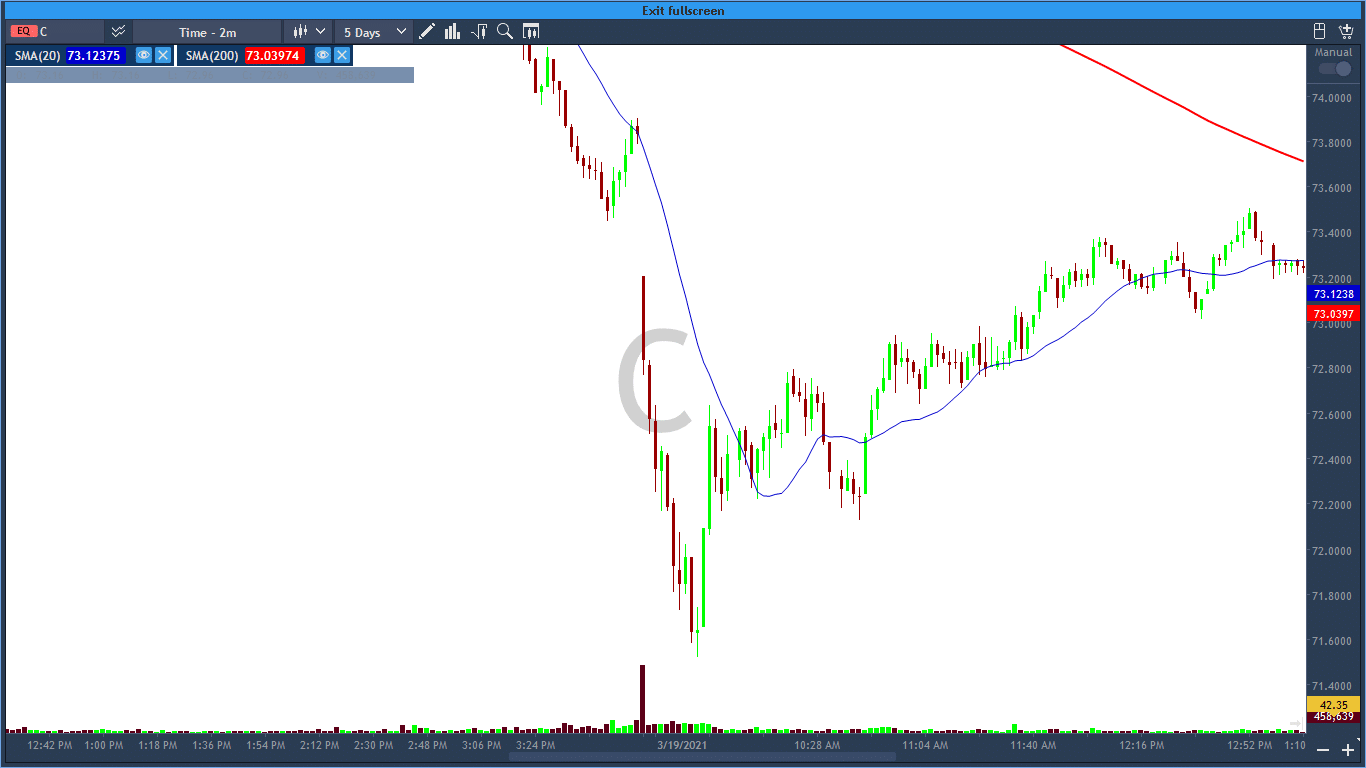
Image 1. We spot a big red bar at the start of the trading day at C. It has a good setup for a potential short where we take a sell with the stop loss above the red bar.

Dead cat bounce

A famous technical setup amongst traders where they short a stock that is already falling with great speed. The selling does not occur during the fall; instead, it happens when the security tries to move upward towards the big red bar. It gets its name from the same conclusion that a bouncing dead cat will not rise anytime. Extreme shorting usually takes place when a big institution dumps the shares.

SL: Between the big red bar or above it.

TP: Towards the next support or as preferable.

Can you figure out the dead cat bounce on the five-minute chart at AMD?

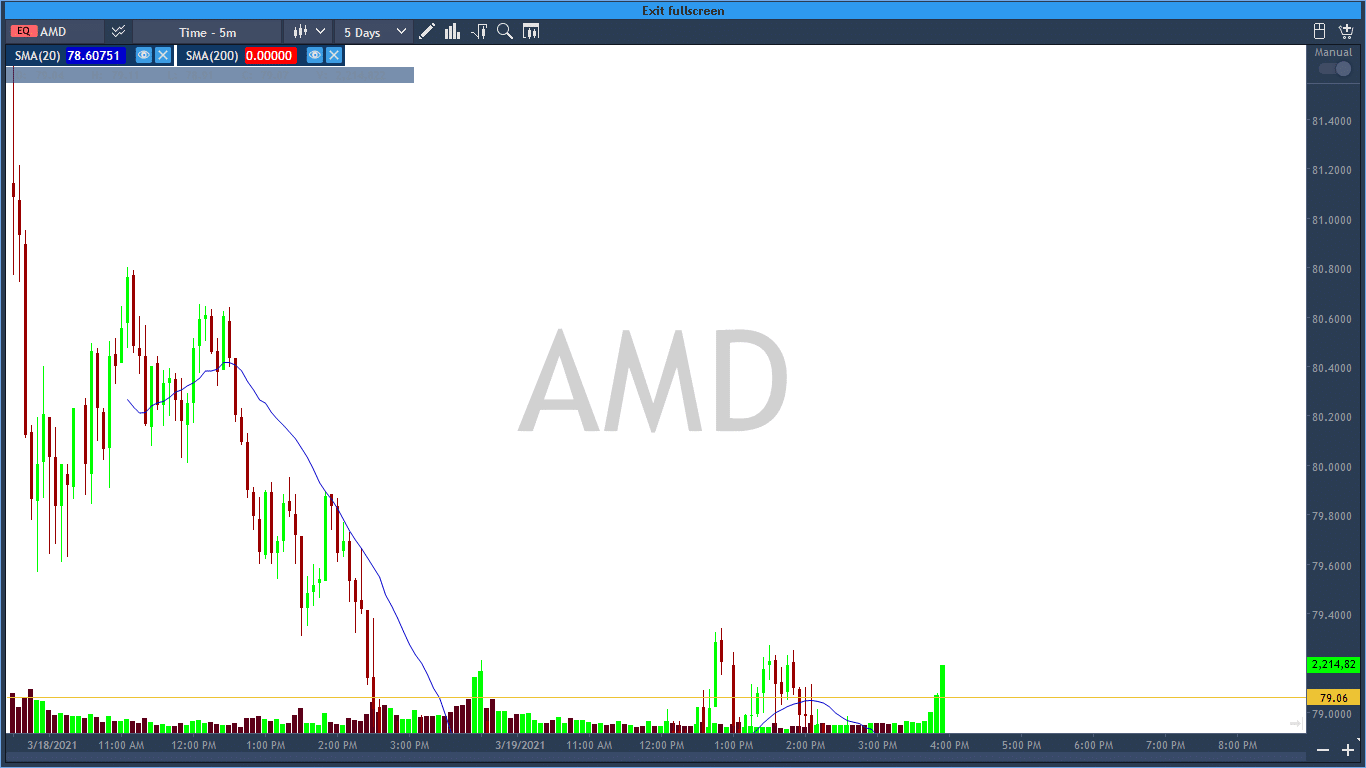
Image 2. Can you figure out the dead cat bounce on the five-minute chart at AMD?

Topping tails

You may have witnessed these candles for quite some time during trading. With topping tails, you can enter reversals. For better winning probability, use them when the stock reaches new highs as 70% fail. Or you can try adding confluence by looking out for the 20 and 200 SMAs.

SL: One cent below/above the candle.

TP: Midpoint of the recent move. Take out Fibs if you need them.

The two minutes’ chart at NVDA shows many topping tail bars. The stock is trying to reach new highs but suffers a downfall immediately after witnessing the bearish candlesticks.

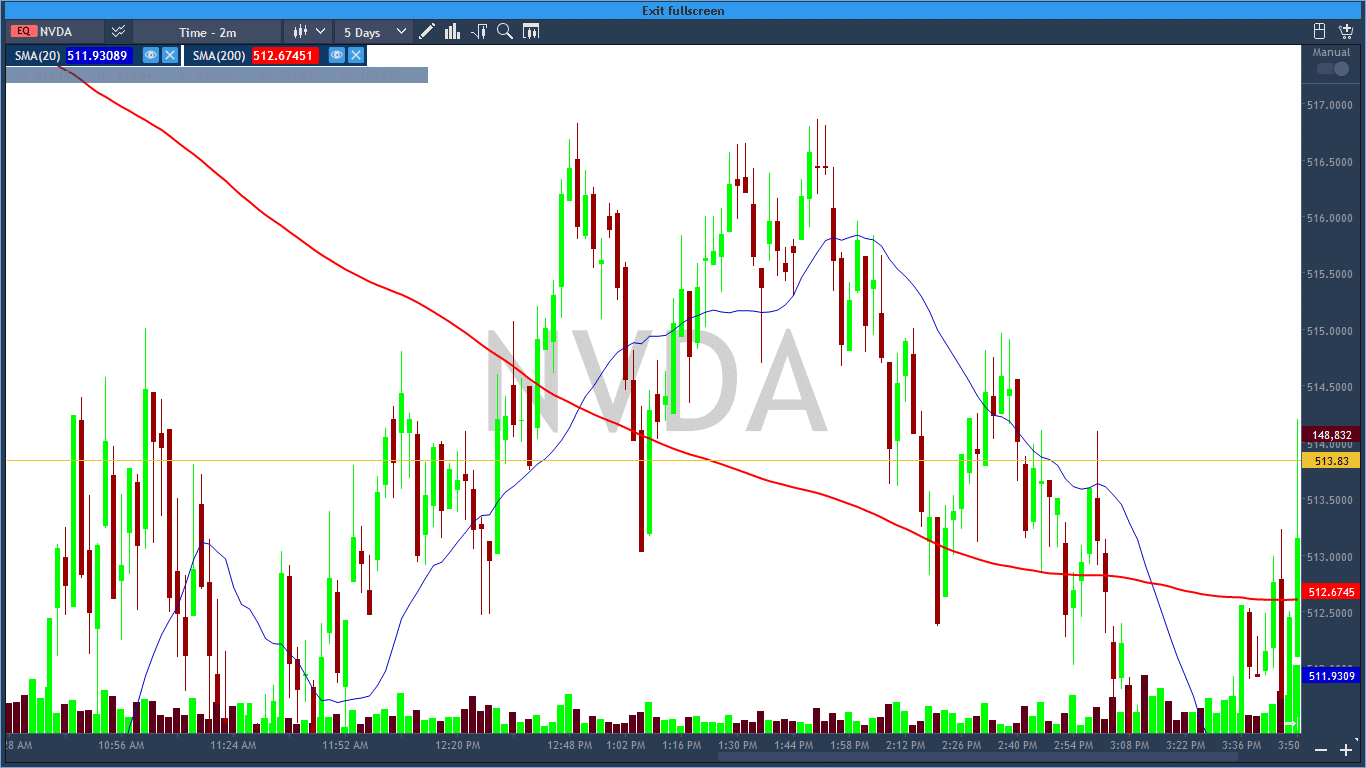
Image 3. The two minutes’ chart at NVDA shows many topping tail bars. The stock is trying to reach new highs but suffers a downfall immediately after witnessing the bearish candlesticks.

Bullish and bearish engulfing

Bullish and bearish engulfing patterns are those where the second big bar engulfs the prior one. It is also a reversal sign which indicates that the current trend is over and respective buyers/sellers are coming over to form a new one. Like topping tails, you can use new highs alongside support and resistance to add to the winning chances.

SL: One cent below/above the candle.

TP: Midpoint of the recent move. Take out Fibs if you need them.

Beautiful bearish engulfing patterns on the Twitter chart. Notice how the market is following its current trends by making subsequent bearish bars on lower highs.

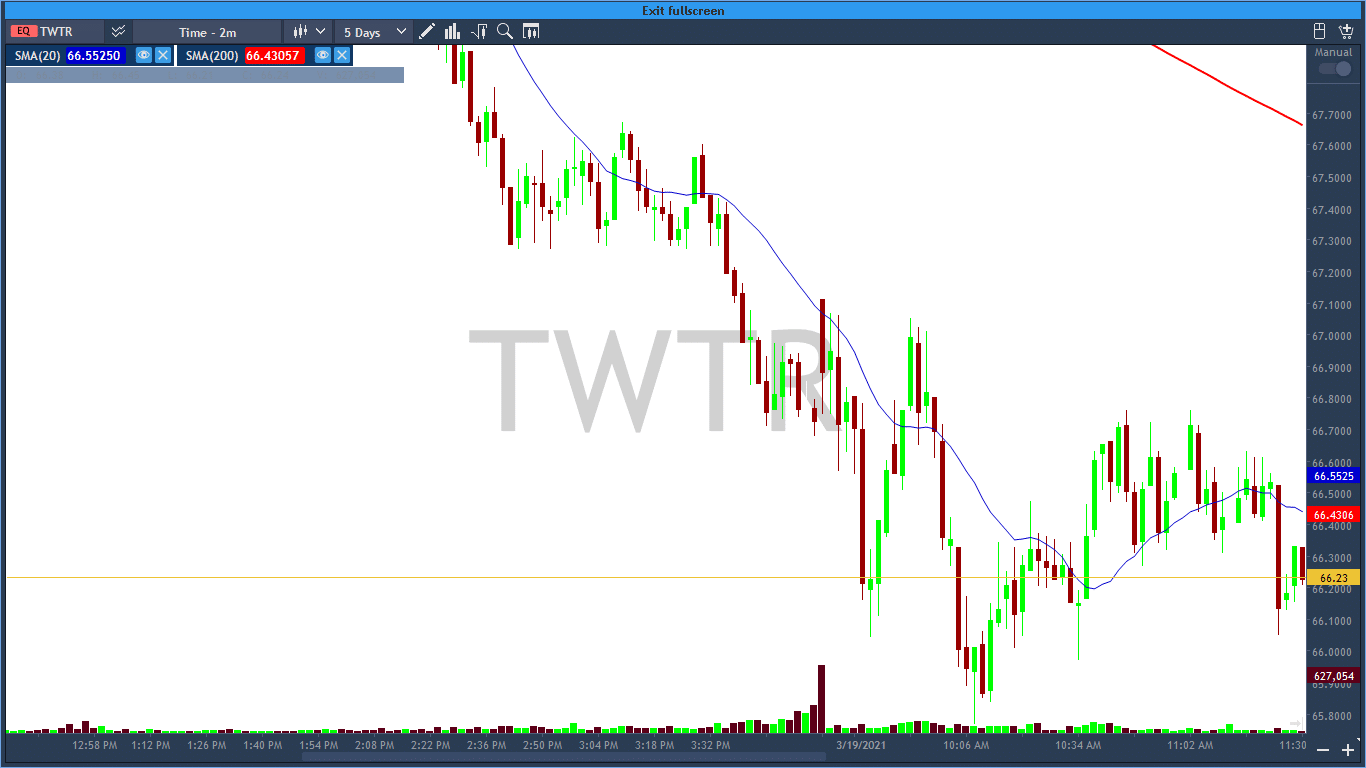
Image 4. Beautiful bearish engulfing patterns on the Twitter chart. Notice how the market is following its current trends by making subsequent bearish bars on lower highs.

Red and green bars ignored

Trading these candlesticks is simple. Just follow the current trend, and whenever a bar of opposite color appears, get ready, we will be placing a trade when the next candle overtakes it. The name rhymes with the statement as the market ignores the previous red or green bars.

SL: One cent below/above the contrasting candle.

TP: Towards next support and resistance.

To make it easier to understand RBI or GBI, we have highlighted the pattern with the yellow color.

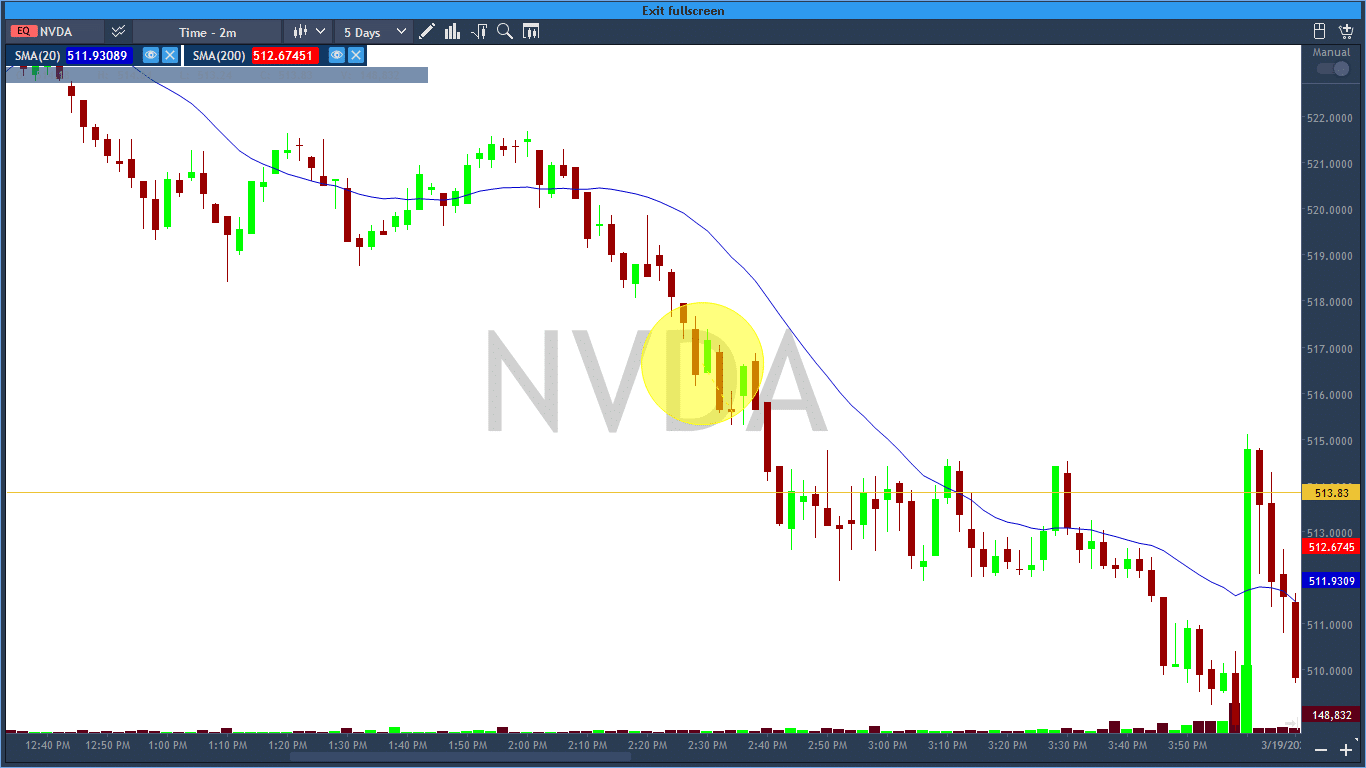
Image 5. To make it easier to understand RBI or GBI, we have highlighted the pattern with the yellow color.

NRB

An NRB, or narrow range bar, provides opportunities with a good amount of risk-reward. It is a small candlestick with a full body that indicates that the market is ready for a massive move in one direction. Place your buy and sell stops one cent above or below the bar as soon as you spot them.

SL: One cent below/above the candle.

TP: Towards next support and resistance.

An insignificant NRB at our disposal. We can still witness the bar's powerful effects where the stock falls $2 in its value after its formation.

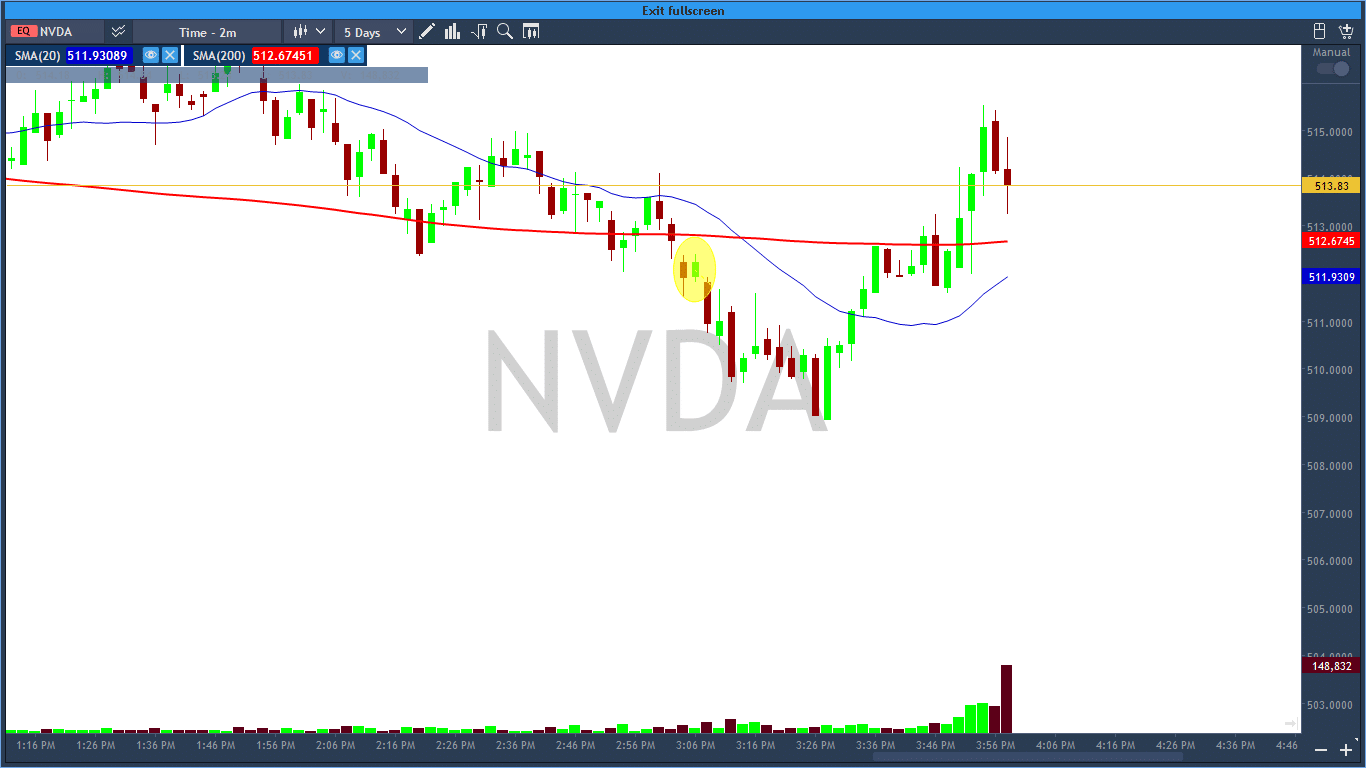
Image 6. An insignificant NRB at our disposal. We can still witness the bar’s powerful effects where the stock falls $2 in its value after its formation.

How much time will it take for me to master these strategies?

Amateur traders may grab these strategies in a month. For beginners, the times may vary, ranging from a few months to a year. It all depends on the type of trader you are and the current level of your trading.

End of the line

Candlestick strategies for day trading stocks are perfect for any beginner to comprehend and implement. However, it would be best if you didn’t ignore other trading factors, such as managing risk. It may take some while for you to execute the trades wisely. For quick executions, experts recommend using hot keys while trading.

Trade like pro, no experience needed
Best Managed Accounts 2022
TweetShareShare
Previous Post

U.S. Looking to Spend $3 Trillion For Long-Term Economic Program

Next Post

FX Scalper X Review

Related Posts

Best 5 Semiconductor Chip Stocks

Best 5 Semiconductor Chip Stocks

May 25, 2022
Semiconductor Stocks: Why Are They Down and When to Buy Them

Semiconductor Stocks: Why Are They Down and When to Buy Them

May 3, 2022
Robinhood Markets Inc.

Robinhood’s Stock Lending Feature Enters Beta Stage

March 17, 2022
Next Post
FX Scalper X

FX Scalper X Review

China's Biggest Chipmaker To Build $2.35 Billion Factory With State Funding

China's Biggest Chipmaker To Build $2.35 Billion Factory With State Funding

Leave a Reply Cancel reply

Your email address will not be published. Required fields are marked *

Top Performing Trading Systems

TechBerry 95%
Forex Cyborg 80%
Automic Trader 75%
DynaScalp 70%
Happy Forex 65%

Follow our Twitter

Popular

  • Filing Forex Trading Taxes IRC 988 vs. IRC 1256: Step-by-Step Guide

    Filing Forex Trading Taxes IRC 988 vs. IRC 1256: Step-by-Step Guide

    0 shares
    Share 0 Tweet 0
  • How To Trade And Invest During The Earnings Season

    0 shares
    Share 0 Tweet 0
  • How to Invest With Grayscale Bitcoin Trust Indicator

    0 shares
    Share 0 Tweet 0
  • Happy News Review

    0 shares
    Share 0 Tweet 0
  • Understanding Wash Trading: Why Is It Banned?

    0 shares
    Share 0 Tweet 0

INVESTING

  • Bonds Investing
  • Crypto Trading
  • Forex Trading
  • Mutual Funds
  • ETFs Investing
  • Real Estate Investing
  • Stock Trading

RETIREMENT

  • 401(k)
  • IRA
  • Retirement Planning
  • Retirement Calculator

REVIEWS

  • Online Brokers
  • Robo Advisors
  • Signal Providers

MONEY MANAGEMENT

  • Banking
  • Financial Advisors
  • Money Market Accounts
  • Savings Accounts

PASSIVE INCOME

  • Automated Trading
  • Managed Accounts
  • Passive Income Apps

Are you looking for the best investment plan?

Let our financial advisors help you

Contact Us

PERSONAL FINANCE

  • Financial Independence
  • Saving Money
  • Paying Off Debt
  • Make More Money
  • Best Managed Accounts
  • Best IRA Accounts
  • Best Forex Brokers
  • Best Forex Robots
  • Best Saving Accounts
  • Best Stock Brokers
  • Best Crypto Platforms
  • Best Crowdsourced Review Sites
  • Home
  • Blog
  • Privacy Policy
  • Disclaimer
  • Contact Us

© 2023, Myfinassets

No Result
View All Result
  • Top
  • Investing
    • Forex Trading
    • Stock Trading
    • Crypto Trading
    • Mutual Funds
    • ETFs Investing
    • Bonds Investing
    • Real Estate Investing
    • Investment Apps
  • Passive Income
    • Automated Trading
    • Managed Accounts
    • Passive Income Apps
  • Money Management
    • Banking
    • Savings Accounts
    • Money Market Accounts
    • Financial Advisors
    • Financial Independence
    • Saving Money
    • Paying Off Debt
    • Make More Money
  • Retirement
    • 401(k)
    • IRA
    • Retirement Planning
    • Retirement Calculator
  • Reviews
    • Online Brokers
    • Robo Advisors
    • Signal Providers
  • News

© 2023, Myfinassets

Welcome Back!

Login to your account below

Forgotten Password?

Retrieve your password

Please enter your username or email address to reset your password.

Log In