Hedge funds use different strategies to enter the market. One of them is to analyze the correlation between assets.
It is no secret that markets are correlated. If the New York Stock Exchange crashes, other markets will likely follow.
For example, it happens with the oil index and oil companies listed on the stock exchange, which tends to move in the same direction.
The same occurs within the crypto market with Bitcoin and altcoins. If Bitcoin suffers a fall, others will follow it due to the existing relationship between coins.
When trading cryptocurrencies, it is necessary to take into account the correlation coefficient. This mathematical indicator will help us know when the currencies move in the same or opposite direction to decide our investments.
We will discuss the usage of this indicator to apply hedging strategies between two cryptocurrencies to protect us against possible market downturns.
What is the correlation coefficient?
Statistics defined it as the specific measure which quantifies the relationship between two variables. But when we talk about trading, these two variables become useful tools.
Therefore, we will define it as the indicator that shows us the similarities of movement that two assets have based on historical and current data.
How does the correlation coefficient work?
The correlation is based on a scale of 1 to -1. So, the closer it is to 1, the more similar assets’ movements are, whether they are moving up or down.
If the correlation is close to -1, it means they’re inversely correlated. One asset may tend to move up, while the other would be moving down.
To use it, open TradingView in the indicators and strategies library.
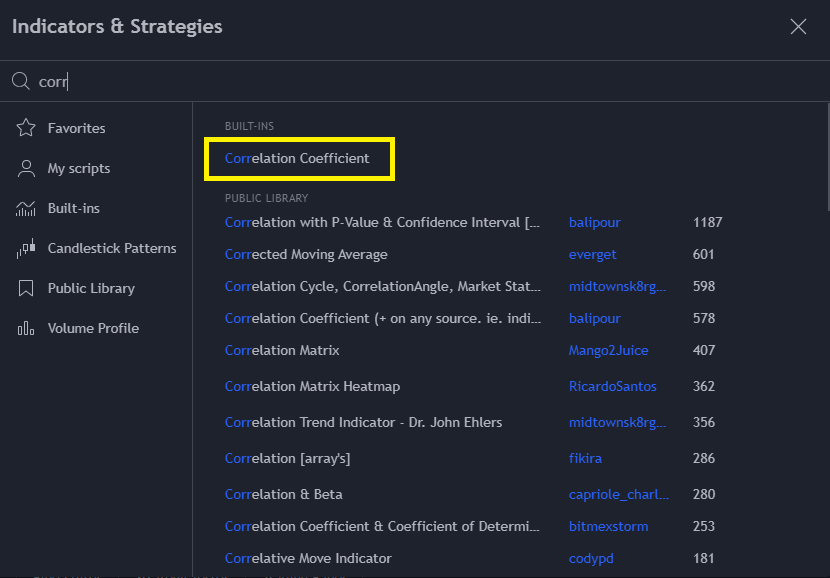
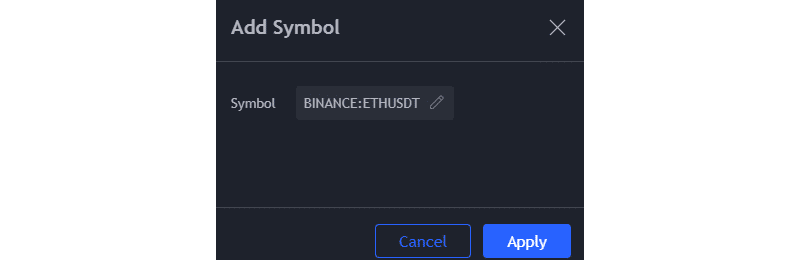
Once you select it, a box will appear where you will have to type the symbol of the asset you want to compare.
The comparison is between the asset on the chart and the one you type in the indicator. So, for example, it can be Bitcoin against Ethereum.
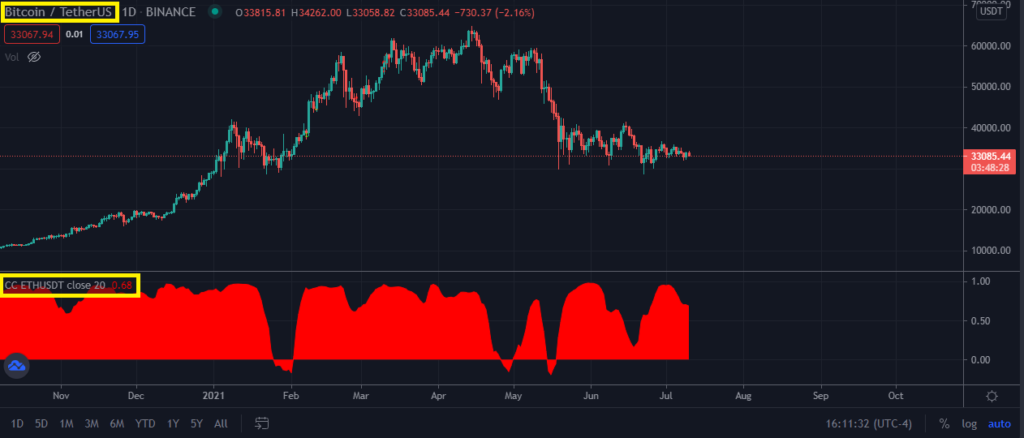
In the image above, we see the daily candlesticks chart of Bitcoin below the indicator, showing the relation with Ethereum.
We observe the correlation has remained closer to 1, indicating that the movements of currencies tend to be alike.
There are many ways to take advantage of this indicator, and it will depend on your objective.
For example, suppose you are thinking of investing in a cryptocurrency like Cardano. In that case, you should analyze the relationship between Cardano and Bitcoin.
Bitcoin is the reference currency, and if it loses its value, all the others also lose.
Cryptocurrencies with the largest market capitalization are highly correlated to Bitcoin. Some altcoins will perform better, depending on the season.
But, if you compare the top ten, you will notice that 80% of the time, they are subject to Bitcoin’s price movements, especially when it falls.
What strategies can we apply with the correlation coefficient in Cryptos?
We can apply several strategies. However, there are two that work well.
Positive Correlation between two coins
To execute the strategy, you must use futures contracts. You can find it on Binance and FTX exchanges.
The strategy consists of placing a long position in one cryptocurrency and a short position in another.
To give an example, we will use Polkadot against Bitcoin. When both are at the point of highest correlation, proceed to open positions. The side will depend on which one you think will go up or down more.
Keep in mind that altcoins like DOT move more in percentage than BTC. Therefore, if we analyze that a rise in the market is coming, you can go long on DOT and go short on BTC.
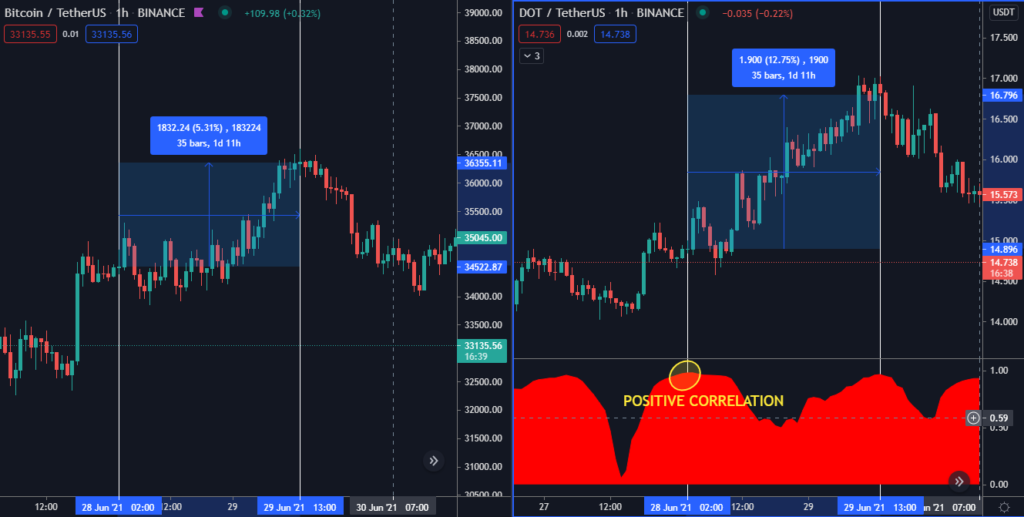
The purpose of this strategy is to protect you against a possible abrupt fall in the market.
To close operations, we must wait for good profits, and this usually happens when the correlation is negative. Trades can last from seconds to days. So, any time frame can be used for this strategy.
Negative correlation between two coins
Here is the opposite approach. Therefore, to execute this strategy, we should expect the prices of both currencies to move in different directions.
In the following image, we see how Cardano (ADA) moves up while Bitcoin (BTC) moves down.
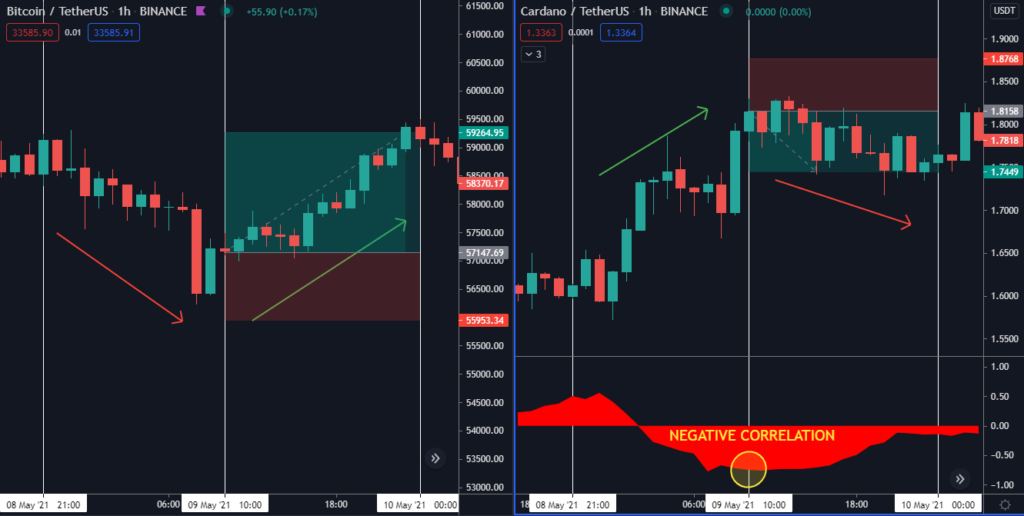
The negative correlation between the two currencies is evident. Still, considering that most of the time they are positively correlated, the ideal in this example would be to buy Bitcoin and sell Cardano.
If you apply theory and confirm it with the statistical data, the trade results should be positive.
Conclusion
There are many possibilities that we can have with this tool. However, in the beginning, it seems a little difficult to master. Still, once you know how to identify the entry and exit points, you will have a remarkable advantage over other traders.
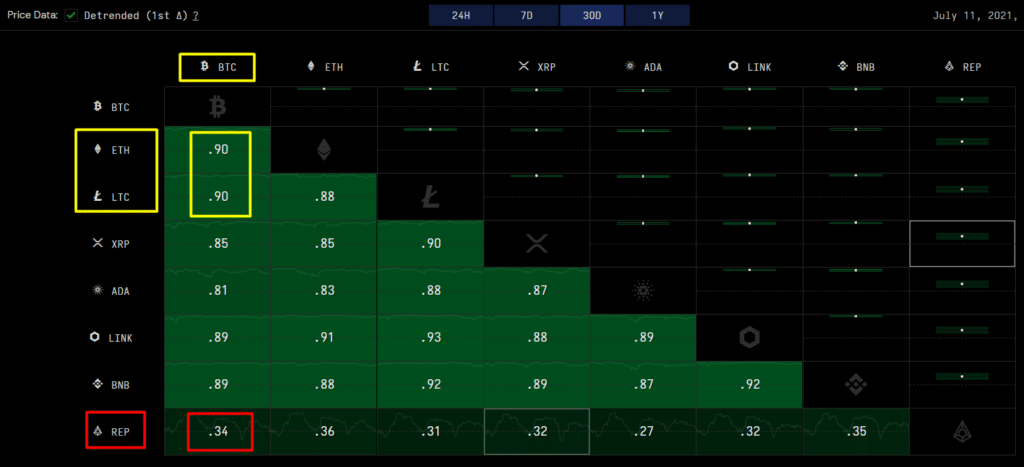
On cryptowat.ch/correlations, you will find a table showing correlations of the leading cryptocurrencies.
You can apply these strategies in other markets, such as stocks, indices, and commodities. Many traders analyze the correlation between the S&P 500 and Bitcoin or gold.
Finally, it is essential to remind you to backtest these strategies and ways to use this indicator. Do it with different assets before investing real money, do not get overleveraged, and avoid significant losses.