
In recent years, cryptocurrencies have become a widely traded financial asset, joining the ranks of forex, commodities, stocks, and other popular assets. Many investors have realized the profit potential contained within these digital assets, and they all want to join the action. However, where there is great upside potential also lies the great risk of loss, and these tokens are no different. For that reason, there is a dire need to understand this volatile market before you can dip your toe into its murky waters.
Analysis techniques in crypto
Similar to most markets, there are two types of analyses carried out in cryptocurrency markets – technical and fundamental. The latter aims at analyzing a digital asset’s intrinsic value, which helps shed light on its viability as an investment.
Usually, fundamental analysis in stocks focuses on the financial health and performance of companies, while that of forex will focus on the economic stability of a country. However, crypto has no centralized authority at its helm. For these digital assets, traders look at indices such as the fear and greed index and the Bitcoin dominance index. They may also look at a project’s whitepaper and its real-life utility, which is mostly utilized by long-term traders.
Technical analysis, on the other hand, resembles that done in other financial markets. Traders use indicators to identify discernible chart patterns and trade in the hope that history repeats itself. These indicators help identify the relationship between a coin’s demand and supply, which sheds light on the likely direction of its price movement. This is mainly used by short-term traders to gain an edge over the market.
Most traders who utilize fundamental analysis are usually long-term traders who practice the HODLing approach. This means that they invest in a coin, then wait for months or even years for its value to rally exponentially before taking their profits. Other traders prefer to day trade crypto, whereby they take advantage of intraday price movements for profit. In this article, we shall be focusing on the strategies this latter type of trader is likely to employ.
Popular crypto day-trading strategies
The RSI strategy
The Relative Strength Index, commonly known in investor circles as the RSI, is a common oscillator that is used across a variety of markets. It contains a vertical scale marked from 0 to 100. This scale contains thresholds at the 70 and 30 levels. Whenever it reads above the 70 threshold, it indicates that the coin in question is overbought. This prompts traders to enter short trades, as the subsequent price action is likely to be a decline.
In the same way, whenever it reads below 30, it indicates that the cryptocurrency is oversold. This means that it is likely to embark on a rally, which calls for the entry of long trades. Let’s look at a practical example.
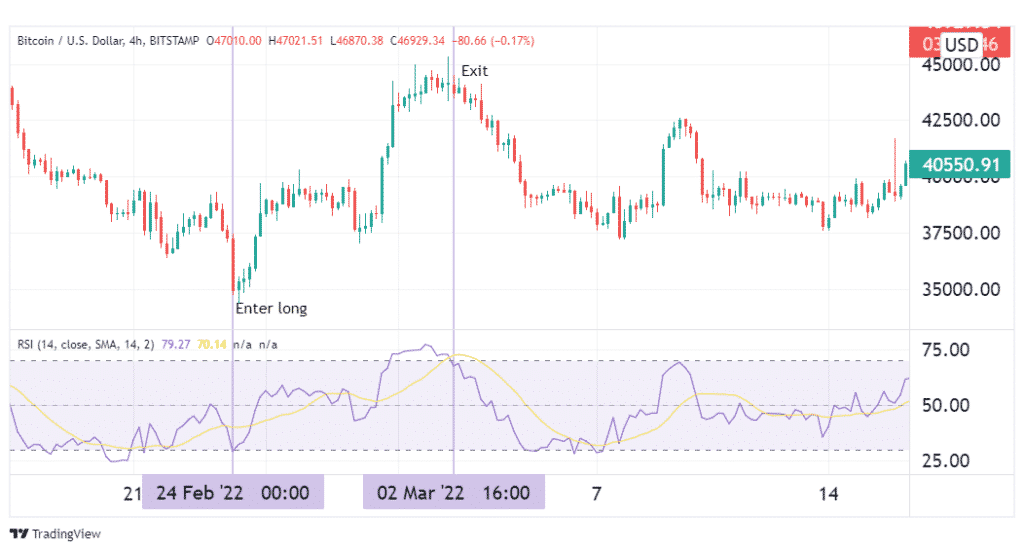
In the illustration above, Bitcoin was oversold on 24th February, which presented an ideal opportunity for entering a long trade. True to the signal, the coin embarked on a rally over the next few days. The exit signal came on 2nd March when RSI showed that the coin was overbought.
The Moving Averages strategy
The most commonly used MA strategy is the crossover. This involves using two EMAs of different lengths. For our intents and purposes, we’ll use the 12 and 26-period EMA. Whenever the 12-period crosses above the 26, this will be marked as a bullish cross and will prompt us to enter long trades. Whenever the 12-period crosses below the longer-term EMA, it will be marked as a bearish cross.
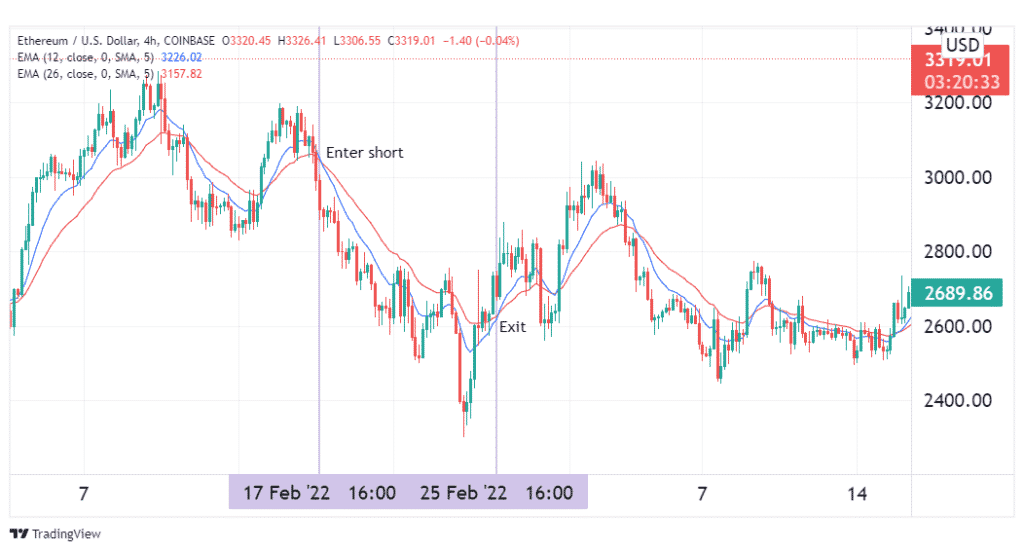
In the image above, the blue 12-period EMA crossed below the red 26-period EMA on 17th February, which was a bearish cross. This was the signal to go short on Ethereum, as its price declined steadily in the following days. The signal to exit our short came on 25th Feb, when a bullish cross manifested.
The Bollinger Bands strategy
Bollinger Bands is an indicator that utilizes a simple MA as its centerline, and lower and upper bands are separated from this line by a standard deviation measure. Whenever prices cross below the middle band to trade against the lower band, this is regarded as a bearish flag. Similarly, when prices cross above the middle band to trend against the upper band, this shows that the coin in question is bullish.
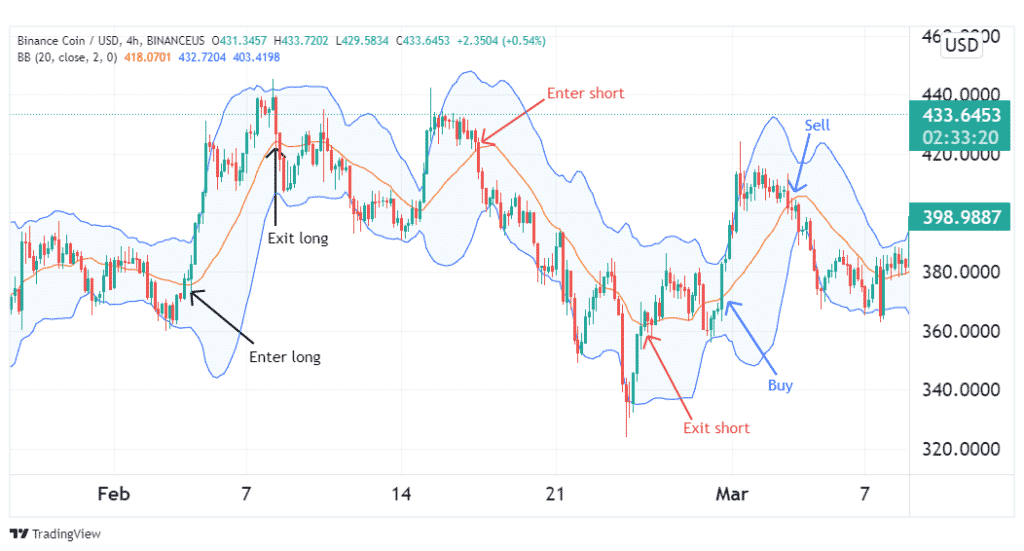
In the illustration above, the BB identified three viable trades on the Binance Coin price chart. The first was a long trade highlighted in black, the second a short trade in red, and the third another long trade as highlighted by the blue arrows.
Word to the wise
Either of the strategies we’ve discussed above can help you make profits in the crypto trade, just as we’ve demonstrated. However, each of these indicators sometimes will give false signals, which could lead to losses if traded.
To remedy this, it is always wise to use a combination of indicators, especially those that give complementary signals. This reduces the probability of trading a false signal by a significant margin, as all your trades will have to satisfy multiple conditions before they can be entered. That being said, you should avoid using too many indicators in a single strategy. For best results, two or three indicators are best.
Conclusion
Cryptocurrencies have become a popular speculative asset amongst investors in recent years. The volatility that characterizes this market presents traders with plenty of profit-making opportunities. However, it also comes with a great risk of loss if the market moves against you. Therefore, it is important to conduct extensive fundamental and technical analysis before entering trades. During technical analysis, it is advisable to utilize multiple complementary indicators for signal confirmation.