
Bitcoin’s explosive run to all-time highs of $68,000 came at the backdrop of increased institutional investors’ interest. As more investors purchased the coin and held it as a long-term investment, the price rallied. Conversely, the conviction held by long-term investors influences cryptocurrencies’ value significantly. One indicator tries to measure this conviction.
Understanding reserve risk indicator
Founded by Hans Hauge, it is an indicator that tries to measure the conviction or confidence about Bitcoin’s or other coins’ long-term prospects at a given time. As a cyclical tool, it tracks the risk-reward balance based on the confidence and conviction of the long-term investors.
Whenever the price of the underlying cryptocurrency, such as bitcoin, is low relative to the confidence, it implies an excellent risk-reward opportunity. This means that long-term investors believe the coin is undervalued relative to its long-term prospects. Conversely, the prospect of prices exploding from these levels is usually high.
Similarly, when the confidence is low, but the price is high, it implies an unattractive risk-reward opportunity. It simply means long-term investors believe the coin is overvalued and thus are not confident of its price increasing. The prospect of price reversing course and moving lower is usually high given the low conviction in the market.
Reserve risk readings
Whenever the indicators reading are below 0.002, a cryptocurrency is considered to be on the green or oversold. The coin has been sold too much, and there may not be more short sellers needed to push the price lower.
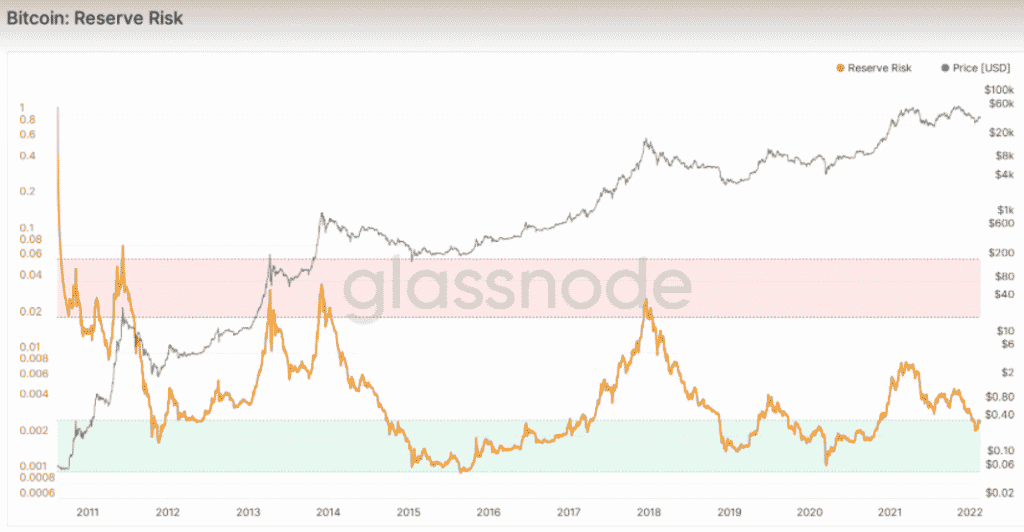
The prospect of a price bounce back occurring at this level is usually high. However, it is essential to note that the prospect of a coin remaining in the oversold territory for long is usually high. Therefore, it is not wise to blindly enter a buy position because the Reserve Risk indicator has turned green.
Likewise, the underlying coin is considered overbought whenever the indicator’s reading is above 0.02. What this means is that the coin has been bought too much, such that there may not be more buyers willing to buy at current levels. The prospects of a price reversal occurring at this level are usually high as conviction drops.
Components to remember
Bitcoin Days: It is a component that denotes the value of coins held by long-term holders. A higher value is given to coins that have not been moved for a long term but remain locked in the wallets.
BD= Number of bitcoins x total number of days held in a given wallet without moving
The metric mostly denotes investors who have held their coins for more than one year without moving or selling. Accordingly, it provides a higher value on amounts that have remained idle for quite some time.
Bitcoin Days Destroyed (BDD): Whenever a bitcoin is moved from a wallet, the action destroys the number of days it has accumulated. For example, this may happen when used to purchase something or transfer it to an exchange to be sold.
Adjusted Bitcoin Days Destroyed (ABDD): denotes the total amount of Bitcoins sold by long-term investors over time. The metric provides valuable insights into whether long-term investors are selling more of their holdings or holding.
Adjusted BDD= BDD/Circulating Supply
Coin Day Destroyed (CDD): whenever a cryptocurrency is unspent and remains locked in a wallet, it gains a coin a day. The accumulated days are destroyed once it is spent. The value of the underlying currency will always correlate to the coin days destroyed indicator.
As the price of the underlying coin increases, so does the incentive to sell as investors look to lock in profits. Equally, if the CDD does not increase while the price increases, it means long-term investors have a strong conviction that the price of the underlying coin will continue to increase, thus no need to sell at current levels.
Median Value of Coin Days Destroyed (MVOCDD): A metric multiplies the median value of coin days destroyed with the prevailing Bitcoin or cryptocurrency price. Whenever there is a difference between price and MVOCDD, it simply means long-term holders are not selling their holdings.
Bank HODL: Every day, an investor holds their coins in a wallet; he forfeits the right to exchange them for cash. The differed opportunity affirms the Holder’s strong belief that the coin will appreciate.
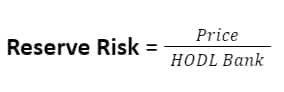
HODL Bank = Price – Median VOCDD
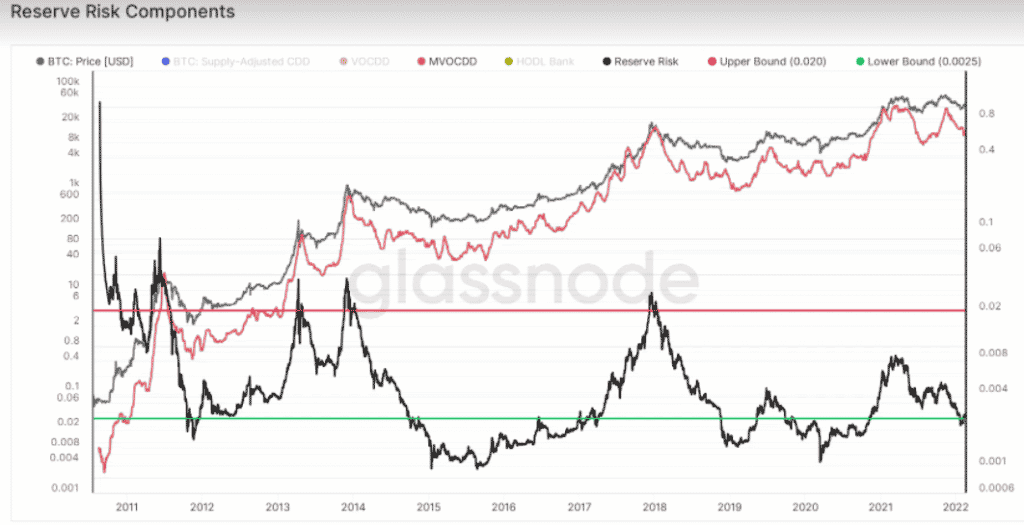
The chart above shows the Reserve Risk indicator reaches the overbought conditions whenever the MVOCDD moves higher above the BTC price, especially when there is a big difference between price and MVOCDD. In addition, HODL bank decreases when MVOCDD moves above the BTC prices.
Factors that influence reserve risk
Whenever the price of the underlying cryptocurrency is increasing, the Reserve Risk will increase as it is in the numerator of the ratio. Conversely, bullish markets are synonymous with a spike in Reserve Risk Indicator. The indicator will also rise due to a decreasing HODL Bank. What this means is that token holders can accrue profits and spend the accrued opportunity costs at the prevailing prices.
On the other hand, the Reserve Risk ratio will decline as the price of the underlying token declines. Conversely, bearish markets come with much lower Reserve Risk indicator readings. In most cases, higher prices are needed to offer long-term investors an incentive to sell their holdings to generate significant profits.
Final thoughts
Reserve Risk is an important technical indicator for people looking to invest while considering what institutional investors or long-term investors are doing. Strong conviction or confidence among the market movers tends to positively impact the investors’ sentiments. Consequently, the price of the coin will increase.
Whenever the Reserve Risk indicator is rising, it implies a strong conviction in the market likely to support further price gains. However, when the reading is above 0.02, it implies an overbought condition; the prospect of a reversal occurring at this level is usually high, given the incentive at hand to sell to accrue significant profits.
Likewise, whenever the indicator is declining, it implies declining conviction in the market. However, the reading plunging below the 0.002 level implies an oversold condition. Therefore, the incentive to buy at highly discounted levels is usually high. For this reason, it is common to find prices bouncing back as investors buy on the dip.